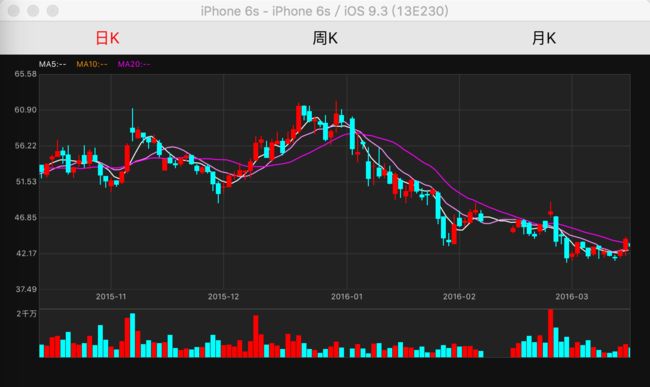
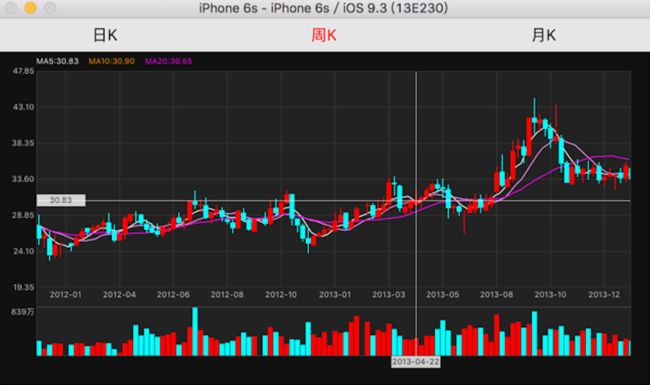
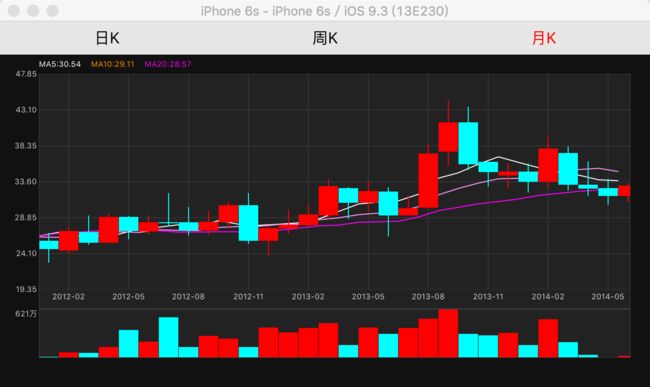
使用CoreGraphics框架实现了k线行情图的基本功能,只有日、周、月k线图,手势包括拖动、缩放、长按。
提示:
1.这是项目前期为了实现功能写的demo,里面很多不规范的代码和设计模式。仅供参看。
2.我开发的k线最新案例请下载App“牛仔网”前往查看。当然设计模式完全不一样,有时间再整理完整的k线开发demo。
画连接线的代码如下:
@interface LXCurveLineView : UIView

@property (nonatomic,strong) NSArray *points; // 多点连线数组
@property (nonatomic,strong) NSArray *colorRGB; // 线条颜色
@property (nonatomic,assign) CGFloat lineWidth; // 线条宽度
@property (nonatomic,assign) BOOL isShadow;// 是否是画阴影

@end


#import "LXCurveLineView.h"
#import "UIColor+helper.h"

@interface LXCurveLineView()
{
    LXKLineSingleton *kLineSingleton;
}
@end

@implementation LXCurveLineView

- (id)initWithFrame:(CGRect)frame
{
    self = [super initWithFrame:frame];
    if (self) {
        // Initialization code
        [self initSet];
    }
    return self;
}

#pragma mark 初始化参数
-(void)initSet
{
    kLineSingleton = [LXKLineSingleton sharedLXKLineSingleton];
    self.contentMode = UIViewContentModeRedraw;
    self.userInteractionEnabled = NO;
    self.backgroundColor = [UIColor clearColor];
    self.colorRGB = COLORRGBARR(0, 0, 0);
    self.lineWidth = 1.0f;
}

-(void)drawRect:(CGRect)rect
{
    if (self.points.count > 0) {
        CGContextRef context = UIGraphicsGetCurrentContext();// 获取绘图上下文
        // 画连接线
        CGContextSetLineWidth(context, self.lineWidth);
        CGContextSetShouldAntialias(context, YES);
        CGContextSetRGBStrokeColor(context, [self.colorRGB[0] floatValue]/255.0f, [self.colorRGB[1] floatValue]/255.0f, [self.colorRGB[2] floatValue]/255.0f, self.alpha);
        [self drawALineWithContext:context withPoints:self.points];
    }
}

#pragma mark 画连接线

- (void)drawALineWithContext:(CGContextRef)context withPoints:(NSArray *)points
{
    //用于画阴影部分的变量
    NSInteger count = points.count;
    CGPoint aPoints[count+2];
    NSInteger index = 0;

    NSInteger noPointNum = 0;
    // 定义多个个点 画多点连线
    for (int i = 0; i < points.count; i++) {
        id item = points[i];
        CGPoint currentPoint = CGPointFromString(item);

        if (self.isShadow) {
            if (index == 0) {
                aPoints[0] = CGPointMake(currentPoint.x, self.height);
            }
            aPoints[++index] = currentPoint;
        }
        if ((int)currentPoint.y<=(int)self.frame.size.height && currentPoint.y>=0) {
            if (i == 0) {
                //定义第一个数据点为线的起点
                CGContextMoveToPoint(context, currentPoint.x, currentPoint.y);
                continue;
            } else if (kLineSingleton.kLineIndex == KLineIndexFive) {
                if ((i)%50 == 0) {
                    //定义五日线的每一天的第一个数据点为线的起点(每五十个点为一天)
                    CGContextMoveToPoint(context, currentPoint.x, currentPoint.y);
                    continue;
                }
            } else if (noPointNum == i && (noPointNum == 5-1 || noPointNum == 10-1 || noPointNum == 30-1)) {
                //几日均线它的前面就有几个点不应该画线(比如最后三十个数据的三十日均线值为零)
                CGContextMoveToPoint(context, currentPoint.x, currentPoint.y);
                continue;
            }

            CGContextAddLineToPoint(context, currentPoint.x, currentPoint.y);
            CGContextStrokePath(context); //开始画线
            if (i
说明
else if (kLineSingleton.kLineIndex == KLineIndexFive) {
    if ((i)%50 == 0) {
        //定义五日线的每一天的第一个数据点为线的起点(每五十个点为一天)
        CGContextMoveToPoint(context, currentPoint.x, currentPoint.y);
        continue;
    }
}
这段代码的作用是在画五日的最新价线和均价线走势时是隔离不会连接在一起的。
else if (noPointNum == i && (noPointNum == 5-1 || noPointNum == 10-1 || noPointNum == 30-1)) {
    //几日均线它的前面就有几个点不应该画线(比如最后三十个数据的三十日均线值为零)
    CGContextMoveToPoint(context, currentPoint.x, currentPoint.y);
    continue;
}
这段代码的作用是在画几日均线它的前面就有几个点不应该画线(比如最后三十个数据的三十日均线值为零),在图上的位置再最左侧。
if (self.isShadow) {
    ......
}
这段代码的作用是在画分时图时最新价的走势线图下方区域显示有色背景。
画一根K线
@interface LXLineView : UIView

@property (nonatomic,strong) NSArray *points; // 多点连线数组
@property (nonatomic,strong) NSArray *colorRGB; // 线条颜色
@property (nonatomic,assign) CGFloat lineWidth; // 线条宽度
@property (nonatomic,assign) BOOL isVol;// 是否是画成交量的实体

@end


#import "LXLineView.h"
#import "UIColor+helper.h"

@interface LXLineView()
{
    LXKLineSingleton *kLineSingleton;
}
@end

@implementation LXLineView

- (id)initWithFrame:(CGRect)frame
{
    self = [super initWithFrame:frame];
    if (self) {
        // Initialization code
        [self initSet];
    }
    return self;
}

#pragma mark 初始化参数
-(void)initSet
{
    kLineSingleton = [LXKLineSingleton sharedLXKLineSingleton];
    self.contentMode = UIViewContentModeRedraw;
    self.userInteractionEnabled = NO;
    self.backgroundColor = [UIColor clearColor];
    self.colorRGB = COLORRGBARR(0, 0, 0);
    self.lineWidth = 1.0f;
    self.isVol = NO;
}

-(void)drawRect:(CGRect)rect
{
    CGContextRef context = UIGraphicsGetCurrentContext();// 获取绘图上下文
    // 画k线
    for (NSArray *item in self.points) {
        // 转换坐标
        CGPoint heightPoint,lowPoint,openPoint,closePoint;
        heightPoint = CGPointFromString([item objectAtIndex:0]);
        lowPoint = CGPointFromString([item objectAtIndex:1]);
        openPoint = CGPointFromString([item objectAtIndex:2]);
        closePoint = CGPointFromString([item objectAtIndex:3]);
        [self drawKWithContext:context height:heightPoint Low:lowPoint open:openPoint close:closePoint width:self.lineWidth];
    }
}

#pragma mark 画一根K线
- (void)drawKWithContext:(CGContextRef)context height:(CGPoint)heightPoint Low:(CGPoint)lowPoint open:(CGPoint)openPoint close:(CGPoint)closePoint width:(CGFloat)width
{
    CGContextSetShouldAntialias(context, NO);
    // 首先判断是绿的还是红的,根据开盘价和收盘价的坐标来计算
    if (self.isVol && kLineSingleton.kLineIndex <= KLineIndexFive) {
        self.colorRGB = @[@"182", @"182", @"182"];
    } else {
        if (openPoint.y >= closePoint.y) {
            // 设置红色
            self.colorRGB = @[@"233", @"75", @"75"];
        } else {
            // 如果开盘价坐标在收盘价坐标上方 则为绿色 即空// 设置为绿色
            self.colorRGB = @[@"87", @"188", @"58"];
        }
    }
    // 设置颜色
    CGContextSetRGBStrokeColor(context, [self.colorRGB[0] floatValue]/255.0f, [self.colorRGB[1] floatValue]/255.0f, [self.colorRGB[2] floatValue]/255.0f, self.alpha);
    if (!self.isVol) {
        // 首先画一个垂直的线包含上影线和下影线
        // 定义两个点 画两点连线
        if (self.lineWidth<=2) {
            CGContextSetLineWidth(context, 0.5); // 上下阴影线的宽度
        } else {
            CGContextSetLineWidth(context, 1); // 上下阴影线的宽度
        }
        const CGPoint points[] = {heightPoint,lowPoint};
        CGContextStrokeLineSegments(context, points, 2);  // 绘制线段(默认不绘制端点)
    } else {
        openPoint = heightPoint;
        closePoint = lowPoint;
    }

    // 再画中间的实体
    CGContextSetLineWidth(context, width>0 ? width:0.5); // 改变线的宽度
    // 开始画实体
    const CGPoint point[] = {openPoint,closePoint};
    CGContextStrokeLineSegments(context, point, 2);  // 绘制线段(默认不绘制端点)
}

@end
- 此demo的效果图如下
- 牛仔网App的效果如下
screen.gif
源码请点击github地址下载。
QQ:2239344645 我的github


