Kmean continued
Kmean 是一种简单又常用的方法,我们再介绍几个例子以及几个关键问题
1. 如何决定应该有多少个cluster?
Kmean的方法要求在尽心分析之前必须先决定有多少个cluster。可以采用三种方法
(1)根据经验,从1个cluster 到n个 cluster 进行试验
(2)elbow plot来决定多少个cluster比较合适
(3)采用NbClust 来决定有少个cluster
推荐用(2)的方法,然后根据经验,并采用(3)来进行验证。再次强调,经验——也就是对你的业务的理解——非常重要。You should know your product in and out!
例子:rattle package里面有一个wine的data,我们用这个作为例子
install.packages("rattle")
data(wine, package = "rattle")
head(wine)
wine.stand<-scale(wine[-1])# To standarize the variables
应该有多少个cluster 合适呢?
Elbow plot的基本思想是:
. If we looks at the percentage of variance explained as a function of the number of clusters: One should choose a number of clusters so that adding another cluster doesn’t give much better modeling of the data. More precisely, if one plots the percentage of variance explained by the clusters against the number of clusters, the first clusters will add much information (explain a lot of variance), but at some point the marginal gain will drop, giving an angle in the graph. The number of clusters is chosen at this point, hence the “elbow criterion”.
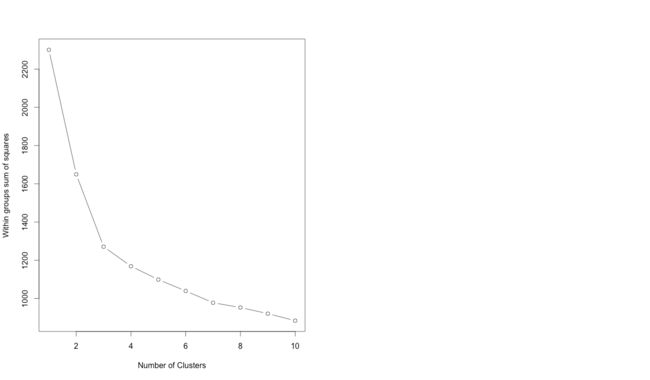
> wssplot(wine.stand, nc=10)
这是10个cluster的情况。可以把纵轴看成是误差,每增加一个cluster,误差减少。直到发现再增加一个cluster的时候,这种误差的减少带来的效应不够明显,那个cluster就是截止点。例如,从一个cluste柔道2个cluster的时候,误差有大幅度降低,增加到3个,继续降低,从3到4的效果,就比从2到3的效果差很多了;从4到5,效果更不明显。
所以,3或4个cluster的方案比较好。
NbClust 提供了一个根据不同标准来决定cluster个数的方案。这个package可以用来验证上面的elbow plot
library("NbClust")
set.seed(1234)
nc <- NbClust(wine.sand, min.nc=2, max.nc=15, method ="kmeans")
所以,我们可以选择 3个cluster的方案。
k.means.fit <- kmeans(wine.stand, 3)
2. 每个cluster的实际意义是什么?或者说,我们怎么解读每个cluster
数学上,这些分组都是根据一定的规则形成的;那么,现实中,我们怎么解释这些分组的意义?把不同的wine分成了多个cluster,每个cluster区别于其他cluster的意义在哪里?
可以先看cluster mean: negative values mean "lower than most" and positive values mean "higher than most"
cluster 1是酒精(alcohol)含量明显高于其他组的一个分组;cluster2是明显低于其他组的一个分组,cluster 3介于之间。
这里也能看到对于业务的理解的重要性。如果你不懂红酒,尽管你能做cluster analysis,但是你没办法解读数据,没办法从数据转换到insights!
我们看一个更生活化的例子:
> url = 'http://www.biz.uiowa.edu/faculty/jledolter/DataMining/protein.csv'
> food <- read.csv(url)
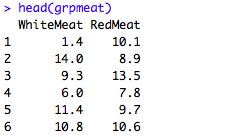
> head(food)
这个各个国家队肉、蛋、牛奶,谷物等蛋白的摄入量。
我们先只对 红肉和白肉的摄入进行聚类:
> set.seed(123456789)
> grpmeat <- food[, c("WhiteMeat", "RedMeat")]
> grpmeat.stand <- scale(grpmeat)
> wssplot <- function(data, nc=15, seed=1234){
+ wss <- (nrow(data)-1)*sum(apply(data,2,var))
+ for (i in 2:nc){
+ set.seed(seed)
+ wss[i] <- sum(kmeans(data, centers=i)$withinss)}
+ plot(1:nc, wss, type="b", xlab="Number of Clusters",
+ ylab="Within groups sum of squares")}
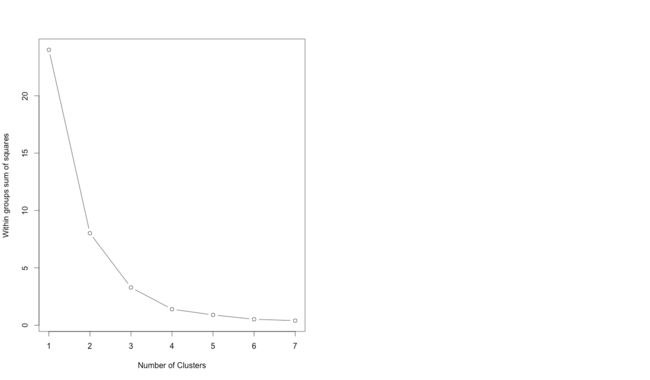
> wssplot(grpmeat.stand, nc=7)
看起来 3~4个cluster比较合适。
我们再验证一下:
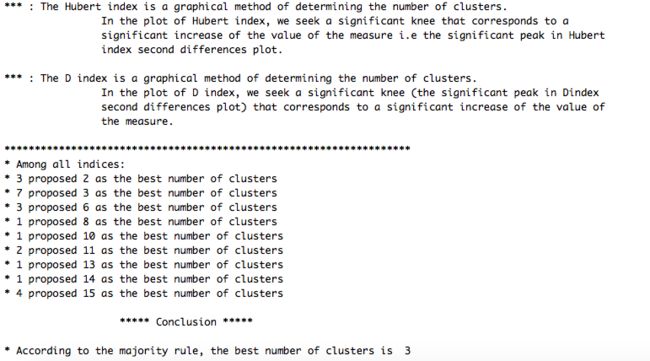
nc <- NbClust(grpmeat.stand, min.nc=2, max.nc=15, method ="kmeans")
我们选择 3个cluster作为 kmean 的方案
> plot(food$Red, food$White, type="n", xlim=c(3,19), xlab="Red Meat", ylab="White Meat")
> text(x=food$Red, y=food$White, labels=food$Country,col=meatcluster$cluster+1)
蛋白摄入以红肉为主的是法国,英国;以白肉为主的是德国,波兰等;瑞典、意大利,希腊等国家属于第三组,他们的摄入较为均匀。
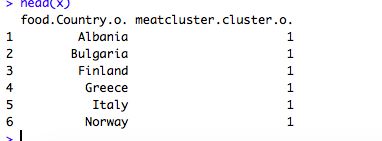
列出每个cluster里面的成员
> o <- order(meatcluster$cluster)
> x <- data.frame(food$Country[o], meatcluster$cluster[o])
> head(x)
3. 如果每个cluster是按照多个维度来划分的,该怎么解读和可视化?
上面的例子因为只有两个维度——redmeat,whitemeat——所以解读起来比较容易,可视化容易,只要在2维图表上表示就可以了。但如果维度增加,该怎么解读cluster的结果,该怎么可视化呢?
这一次,我们把所有蛋白质摄入的渠道都作为一个维度,
> url = 'http://www.biz.uiowa.edu/faculty/jledolter/DataMining/protein.csv'
> food <- read.csv(url)
> head(food)
> set.seed(123456789)
> grpmeat<- food[, -1]
> head(grpmeat)
> grpmeat.stand <- scale(grpmeat)
> wssplot <- function(data, nc=15, seed=1234){
+ wss <- (nrow(data)-1)*sum(apply(data,2,var))
+ for (i in 2:nc){
+ set.seed(seed)
+ wss[i] <- sum(kmeans(data, centers=i)$withinss)}
+ plot(1:nc, wss, type="b", xlab="Number of Clusters",
+ ylab="Within groups sum of squares")}
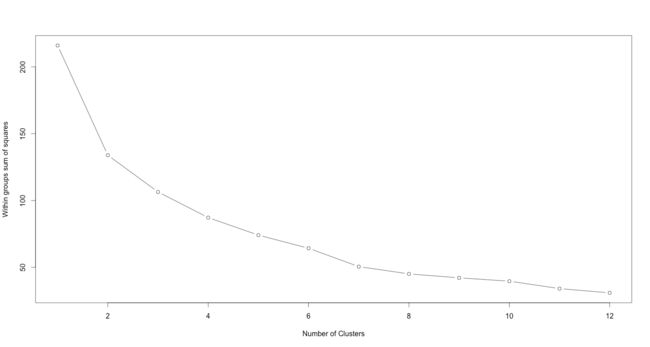
> wssplot(grpmeat.stand, nc=12)
从elbow plot可以看出来,7个cluster是较为理想的方案。
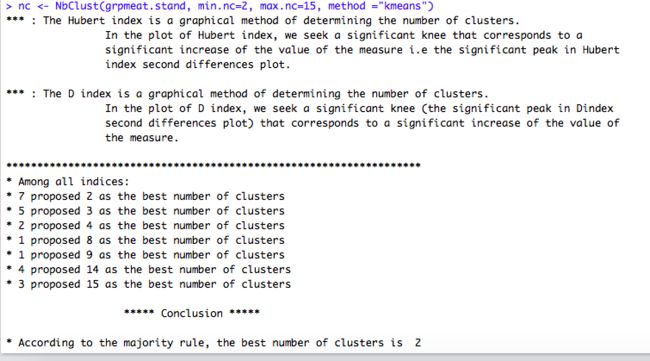
在次验证一下
出现问题了,NbClust推荐的是2个cluster。根据elbow plot,我们还是建议7个cluster的方案。
kmean的结果如下:
The nstart argument tells kmeans to try that many random starts and keep the best.With 20 or 25 random starts, you’ll generally find the overall best solution unless your sample size is really big.
一共9个维度,几乎很难直观的解释为什么一些点会被分到一个cluster里面。2维图表也没办法展示不同的分组,所以,我们需要降维技术——将一些维度合并,然后将9个维度降低到5个,4个,3个,2个等。
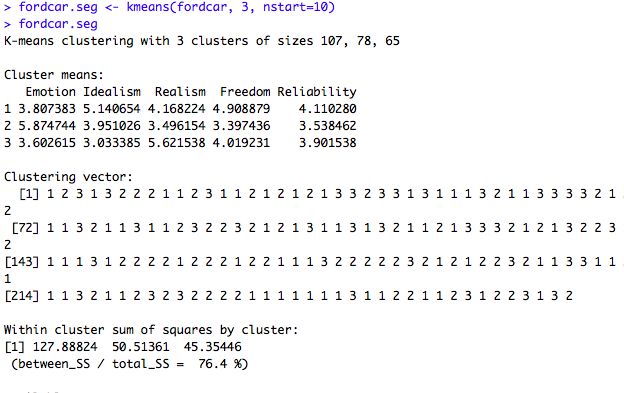
最后再看一个实例。福特为了在欧洲销售汽车,决定研发一款新型的汽车。他对们消费者进行了调研,通过调研发现,消费者最在意的是5个指标——emotion,idealist,realism,freedom,reliability。
然后,福特让消费者这5个指标进行重要性打分,分值越高,说明他们在某一个属性上的需求就越强烈。dataset如下图,一共有250个有效用户的数据。
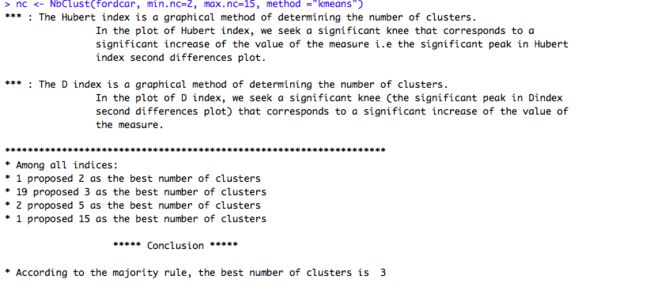
首先我们判断一下可能有多少个cluster。elbow 图很有意思,3,4 个cluster的方案没有太多区别,5个cluster之后的方案也没有太多区别。所以,有可能的cluster的方案可能是3,4,或者5个。需要对每一种方案进行分析,最后决定合适的cluster方案。
3 cluster的方案
cluster 1注重idealism和freedom,cluster 2注重emotion,cluster 3 注重 realism
4个cluster的方案
cluster1: idealism
cluster2:realism
cluster 3: emotion
cluster 4: freedom
5个cluster的方案
cluster1: emotion
cluster2:emotion with freedom
cluster 3: idealism
cluster 4: ideamlism and freedom
cluster 5:realism
到底多少个cluster合适?这是个judgement call。不仅要存在分组,而且分组要有意义。我认为4个cluster较好。
Reference
https://rstudio-pubs-static.s3.amazonaws.com/33876_1d7794d9a86647ca90c4f182df93f0e8.html
http://beyondvalence.blogspot.com/2013/12/cluster-analysis-choosing-optimal.html


