import matplotlib.pyplot as plt
import numpy as np
import pylab as pl

x1=[1,2,3,4,5]
y1=[1,4,9,16,25]

x2=[1,2,4,6,8]
y2=[2,4,8,12,16]

plot1=pl.plot(x1, y1, "r")
plot2=pl.plot(x2,y2,"go")

pl.title("Plot of y vs. x")

pl.xlabel("x axis")
pl.ylabel("y axis")

pl.xlim(0.0,  9.0)
pl.ylim(0.0,  30.0)

pl.legend([plot1, plot2],  ("red line", "green circles"), "best", numpoints=1)
##pl.legend([plot1, plot2])

pl.show()
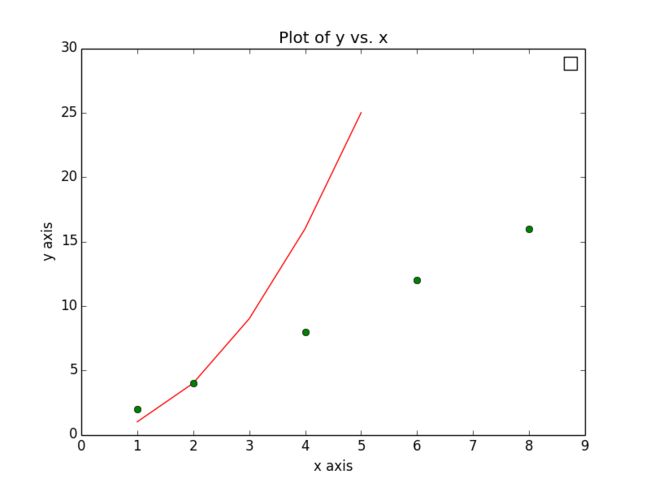
结果能显示,但是无法显示标签label。
报错信息:
Warning (from warnings module):
  File "C:\Python27\lib\site-packages\matplotlib\legend.py", line 613
    (str(orig_handle),))
UserWarning: Legend does not support []
Use proxy artist instead.

http://matplotlib.sourceforge.net/users/legend_guide.html#using-proxy-artist


Warning (from warnings module):
  File "C:\Python27\lib\site-packages\matplotlib\legend.py", line 613
    (str(orig_handle),))
UserWarning: Legend does not support []
Use proxy artist instead.

http://matplotlib.sourceforge.net/users/legend_guide.html#using-proxy-artist
=======================================================
修正代码:
import matplotlib.pyplot as plt
import numpy as np
import pylab as pl

x1=[1,2,3,4,5]
y1=[1,4,9,16,25]

x2=[1,2,4,6,8]
y2=[2,4,8,12,16]

plot1, =pl.plot(x1, y1, "r")                  #   这个 ,一定要有,不然legend会报错
plot2, =pl.plot(x2,y2,"go")

pl.title("Plot of y vs. x")

pl.xlabel("x axis")
pl.ylabel("y axis")

pl.xlim(0.0,  9.0)
pl.ylim(0.0,  30.0)

pl.legend([plot1, plot2],  ("red line", "green circles"), "best", numpoints=1)
##pl.legend([plot1, plot2])

pl.show()
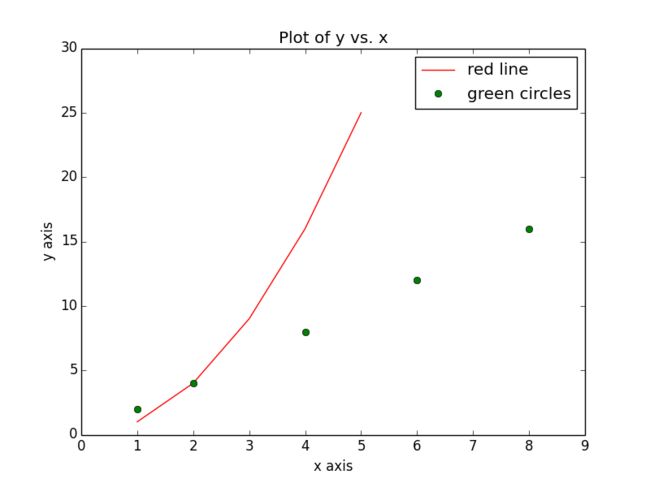
图示:
终于解决了TnT

