本文原版地址:
http://firsttimeprogrammer.blogspot.ca/2015/02/how-to-fit-copula-model-in-r.html
本文是一系列文章中的一部分,翻译主要是为了自己理解copula是什么,不精确到句子和词。
我从事copula的相关工作很久了,老实说,R关于此问题的文档,比起那些python来说,差得太远了.由于copula本身就很难,这就使得问题更难被解决了.其中最大的问题还是在于例子少,用户也少.如果你有好资源推荐,欢迎在下面留言,我也会留下一部分资源.
如果你刚听说copulas,或许可以先去看看introduction to the Gumbel copula in R here.
我接下来要用的package是copula package,一个很好的工具,安装也很便利.
Dataset
这里我用一个简单数据,股票x和股票y,可以在此下载.
首先我们要加载数据到矩阵.记得要先加载copula package.
x <- read.table("/home/kevin/Downloads/x.txt")
y <- read.table("/home/kevin/Downloads/y.txt")
mat <- matrix(nrow = 100, ncol = 2)
for(i in 1:100)
{
mat[i,1] <- x[,1][i]
mat[i,2] <- y[,1][i]
}
plot(mat[,1],mat[,2],main="Returns",xlab="x",ylab="y",col="blue")
# cor(mat[,1],mat[,2])
用plot函数作图之后如下.
下一步就是要进行copula了.为了让数据可用,我们需要选择合适的copula模型,该模型应该基于给出的数据及一些其他因素.我们可以初步估计出这个数据集有一定的正相关,因此能够反映这种关系的copula都是可以的.要小心的是,copula模型会越来越复杂,这种靠眼睛看的方式很难一直奏效.我选择用normal copula.当然下列过程对其他copula也适用.
我们来拟合以下数据.
# normal copula
normal.cop <- normalCopula(dim = 2)
fit.cop <- fitCopula(normal.cop,pobs(mat),method="ml")
# Coefficients
rho <- coef(fit.cop)
print(rho)
注意数据要通过pobs()输送,该参数会将真实数据转换为伪数据以符合[0,1]区间要求.
另外,这里我们选用的是ml方法--极大似然方法,其他方法也可以,比如itau.
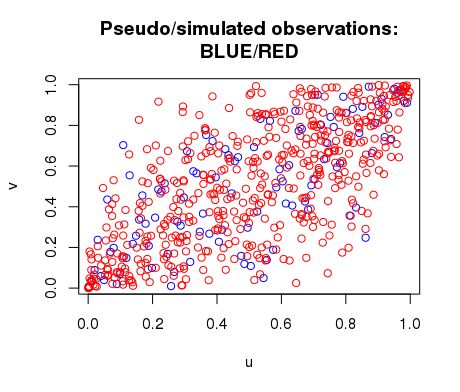
我们可以plot伪数据和模拟数据,可以发现copula模拟很好的匹配了伪数据.
# Pseudo observations
p_obs <- pobs(mat)
plot(p_obs[,1],p_obs[,2],main="Pseudo/simulated observations:
BLUE/RED", xlab="u",ylab="v",col="blue")
# Simulate data
set.seed(100)
u1 = rCopula(500,normalCopula(coef(fit.cop),dim = 2))
points(u1[,1],u1[,2],col="red")
我们选用的这个copula还可以,但不是最好的,因为它有较大的尾部相关,而数据本身并没有那么大.不过这只是我们的一个尝试而已.
我们还可以选择用柱状图显示随机变量的分布,如下:
# Plot data with histograms
xhist <- hist(mat[,1],breaks = 30,plot = FALSE)
yhist <- hist(mat[,2],breaks = 30,plot = FALSE)
top <- max(c(xhist$counts, yhist$counts))
xrange <- c(-4,4)
yrange <- c(-6,6)
nf <- layout(matrix(c(2,0,1,3),2,2,byrow=TRUE),c(3,1),c(1,3),
TRUE)
# for the matrix, it simplely means put position of #n of plot;
# for c(3,1), it means col1 is 3x width more than col2, vice versa
par(mar=c(3,3,1,1))
plot(mat[,1],mat[,2],xlim=xrange,ylim=yrange,xlab="",ylab="")
par(mar=c(0,3,1,1))
barplot(xhist$counts, axes = FALSE, ylim = c(0,top),space=0)
par(mar=c(3,0,1,1))
barplot(yhist$counts, axes = FALSE, xlim = c(0,top),space=0,
horiz = TRUE)
得到如下的图像:


