Second part of post: numpy tips and tricks 2
I used example from histogram equalization with numpy
Numpy log-likelihood benchmark
Argsort
根据一列的信息来对另一列排序
比如要对人根据身高进行排序
ages = np.random.randint(low=30, high=60, size=10)
heights = np.random.randint(low=150, high=210, size=10)
sorter = np.argsort(ages)
print(ages[sorter])
print(heights[sorter])
根据生成的索引进行排序
permutation = np.random.permutation(10)
original = np.array(list('abcdefghij'))

print(permutation)
print(original)
print(original[permutation])
[1 7 4 9 2 8 0 5 6 3]
['a' 'b' 'c' 'd' 'e' 'f' 'g' 'h' 'i' 'j']
['b' 'h' 'e' 'j' 'c' 'i' 'a' 'f' 'g' 'd']
逆向排序
inverse_permutation = np.argsort(permutation)

print(original[permutation][inverse_permutation])
['a' 'b' 'c' 'd' 'e' 'f' 'g' 'h' 'i' 'j']
计算排名
data = np.random.random(10)

print(data)
print(np.argsort(np.argsort(data)))

from scipy.stats import rankdata
rankdata(data) - 1
分布平滑
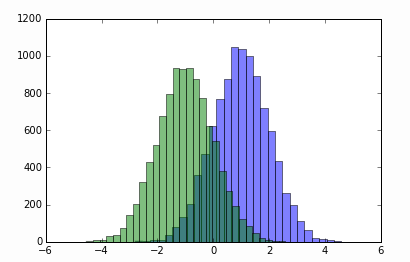
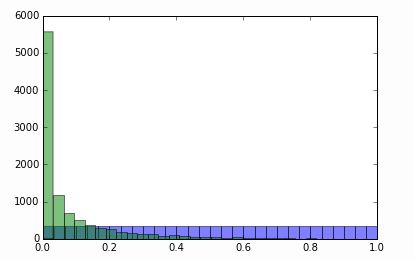
写一个单调的变换可以使得我们把一个分布变为均匀分布等等,这种方法在比较两个分布的时候是很常见的,尤其是那种有着奇怪的形状和尾巴的。
class IronTransform:
    def fit(self, data, weights):
        weights = weights / weights.sum()
        sorter = np.argsort(data)
        self.x = data[sorter]
        self.y = np.cumsum(weights[sorter])
        return self

    def transform(self, data):
        return np.interp(data, self.x, self.y)
sig_pred = np.random.normal(size=10000) + 1
bck_pred = np.random.normal(size=10000) - 1
from matplotlib import pyplot as plt
plt.figure()
plt.hist(sig_pred, bins=30, alpha=0.5)
plt.hist(bck_pred, bins=30, alpha=0.5)
plt.show()
在转换后:
这个函数也可以用来做直方图均衡化,这是图像处理当中调整对比度的方法。
from PIL import Image
image = np.array(Image.open('AquaTermi_lowcontrast.jpg').convert('L'))
flat_image = image.flatten()
result = IronTransform().fit(flat_image, weights=np.ones(len(flat_image))).transform(image)

plt.figure(figsize=[14, 7])
plt.subplot(121), plt.imshow(image, cmap='gray'), plt.title('original')
plt.subplot(122), plt.imshow(result, cmap='gray'), plt.title('after histogram equalization')
plt.show()
值得一提的是,当处理过大或者过小的数字的时候可以用numpy.clip
np.clip([-100, -10, 0, 10, 100], a_min=-15, a_max=15)
array([-15, -10,   0,  10,  15])

x = np.arange(-5, 5)
print(x)
print(x.clip(0))

[-5 -4 -3 -2 -1  0  1  2  3  4]
[0 0 0 0 0 0 1 2 3 4]
Broadcasting, numpy.newaxis
有权重的协方差矩阵
data = np.random.normal(size=[100, 5])
weights = np.random.random(100)
def covariation(data, weights):
    weights = weights / weights.sum()
    return data.T.dot(weights[:, np.newaxis] * data)
covariation(data, np.ones(len(data)))
也可以通过这种方法:
np.einsum('ij, ik, i -> jk', data, data, weights / weights.sum())
计算两个向量之间的距离
X = np.random.normal(size=[1000, 100])
distances = ((X[:, np.newaxis, :] - X[np.newaxis, :, :]) ** 2).sum(axis=2) ** 0.5
products = X.dot(X.T)
distances2 = products.diagonal()[:, np.newaxis] + products.diagonal()[np.newaxis, :]  - 2 * products
distances2 **= 0.5
也可以使用包包
from sklearn.metrics.pairwise import pairwise_distances
distances_sklearn = pairwise_distances(X)

np.allclose(distances, distances_sklearn), np.allclose(distances2, distances_sklearn)
Unique
类别变量转换
类似于labelencoder的功能,能很快的把他进行类别的编码
unique_categories, new_categories = np.unique(categories, return_inverse=True)
当我们需要检测是否在一个list中的时候可以用这个命令
np.in1d(['ab', 'ac', 'something new'], unique_categories)
处理缺失情况
class CategoryMapper:
    def fit(self, categories):
        self.lookup = np.unique(categories)
        return self

    def transform(self, categories):
        """Converts categories to numbers, 0 is reserved for new values (not present in fitted data)"""
        return (np.searchsorted(self.lookup, categories) + 1) * np.in1d(categories, self.lookup)
CategoryMapper().fit(categories).transform([unique_categories[0], 'abc'])
percentile
edges = np.percentile(x, np.linspace(0, 100, 20))
_ = plt.hist(x, bins=edges, normed=True)
除了onehot编码,对于类别变量来说还有很多的技巧比如,我们可以将每一个变量的值替换成这个值在数据中出现的次数
np.bincount(new_categories)[new_categories]
另一个技巧就是在这里将值替换成每一个事件的预测的可能性,这个是更加复杂的技巧,因为我们需要对于这个增加一些权重。
predictions = np.random.normal(size=len(new_categories))

means_over_category = np.bincount(new_categories, weights=predictions) / np.bincount(new_categories)
means_over_category[new_categories]
同样的技巧,如果我们想测度数据的偏差程度的话:
means_of_squares_over_category = np.bincount(new_categories, weights=predictions**2) / np.bincount(new_categories)
var_over_category = means_of_squares_over_category - means_over_category ** 2
var_over_category[new_categories]
unfunc
进一步的说,我们可以通过一系列的二元函数来做,比如:
numpy.add, numpy.subtract, numpy.multiply, numpy.maximum, numpy.minimum
在下面的例子中我们会用ufunc.at
max_over_category = np.zeros(new_categories.max() + 1) - np.infty
np.maximum.at(max_over_category, new_categories, predictions)

print(max_over_category[new_categories])
当我们需要计算每一个组合的次数的时候,通常有两种方法,可以将一系列的变量变成一个,比如:feature1 * (numpy.max(feature2) + 1) + feature2
在比如做一个多维度的表格。
first_category = np.random.randint(0, 100, len(new_categories))
second_category = np.random.randint(0, 100, len(new_categories))

counters = np.zeros([first_category.max() + 1, second_category.max() + 1])
np.add.at(counters, [first_category, second_category], 1)
现在我们可以用colected 统计来做一点有用的事情
counters[first_category, second_category]

# occurences of second category
counters.sum(axis=0)[second_category]
# maximal occurences of second category with same value of first category
counters.max(axis=0)[second_category]
# number of occurences of second category with fixed first category:
counters[42, second_category]
计算ROC曲线
你可以用sklearn.metrics.roc_curve来实现。roc曲线爆款三个输入变量,首先是她的label(二元0或者1),预测(真实值)以及权重
def roc_curve(labels, predictions, sample_weight):
    sig_weights = sample_weight * (labels == 1)
    bck_weights = sample_weight * (labels == 0)
    thresholds, predictions = np.unique(predictions, return_inverse=True)
    tpr = np.bincount(predictions, weights=sig_weights)[::-1].cumsum()
    fpr = np.bincount(predictions, weights=bck_weights)[::-1].cumsum()
    tpr /= tpr[-1]
    fpr /= fpr[-1]
    return fpr, tpr, thresholds[::-1]
或者
# sometimes sklearn adds one more element to all arrays.
# I have no idea why this is needed and when, but in this case all answers turn to False
from sklearn.metrics import roc_curve as sklearn_roc_curve
fpr2, tpr2, thr2 = sklearn_roc_curve(labels, predictions, sample_weight=weights)
np.allclose(fpr1, fpr2), np.allclose(tpr1, tpr2), np.allclose(thr1, thr2)
有权重的Kolmogorov-Smironv distace
roc 去显示一个重要的在机器学习领域很重要的工具因为它可以比较有序的信息针对原来的分布
接下来我们来计算基于ROC的KS
ks=max|F1(x)-F2(X)|
def ks_2samp(distribution1, distribution2, weights1, weights2):
    labels = np.array([0] * len(distribution1) + [1] * len(distribution2))
    predictions = np.concatenate([distribution1, distribution2])
    weights = np.concatenate([weights1, weights2])

    fpr, tpr, _ = roc_curve(labels, predictions, sample_weight=weights)
    return np.max(np.abs(fpr - tpr))


