文件格式
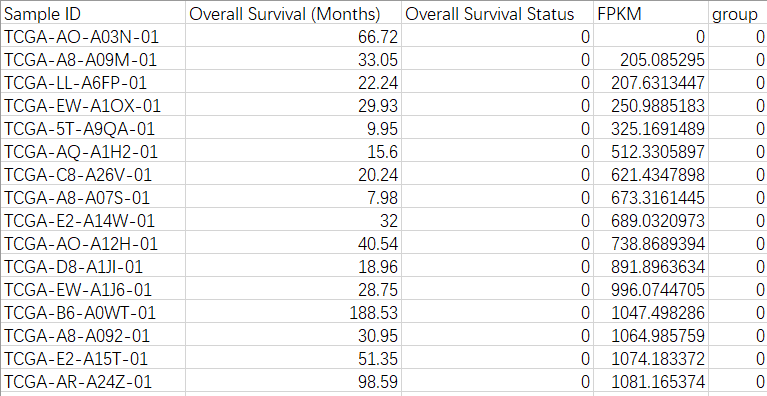
生存状态(布尔值):0-Alive;1-Dead
group:根据fpkm值将其分为高表达(1)和低表达(0)
library(survival)
library(rJava)
library(xlsxjars)
library(xlsx)
Baseline<-read.xlsx('./BRCA/1.xlsx',sheetIndex = 25,header = T)
Lisurv<-Surv(time = Baseline$Overall.Survival..Months.,event = Baseline$Overall.Survival.Status)
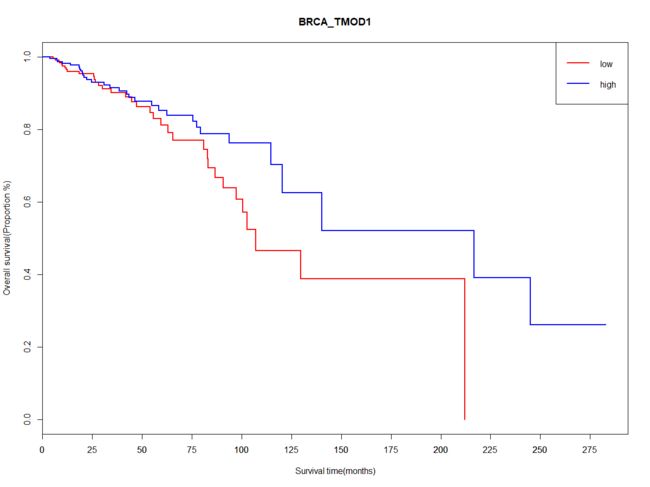
Lifit<-survfit(Lisurv~Baseline$group)
plot(Lifit,conf.int = 'none',col = c('red','blue'),lwd = 2,main="BRCA_TMOD1",xlab = "Survival time(months)",ylab = "Overall survival(Proportion %)")
axis(1,at=seq(0,300,25))
legend("topright",c("low","high"), lty = c(1, 1),lwd=c(2,2),col = c("red","blue"))
####p值
a<-survdiff(Lisurv~Baseline$group)
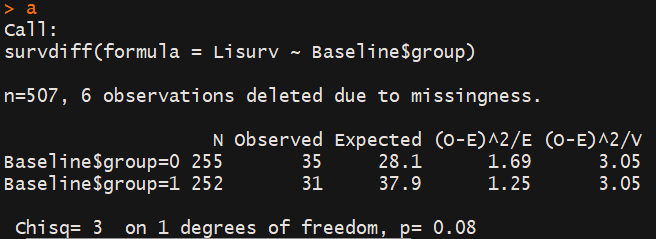
p<- 1-pchisq(a$chisq,length(a$n)-1)
temp <- locator(1)
text(temp,'p=0.0008')
2
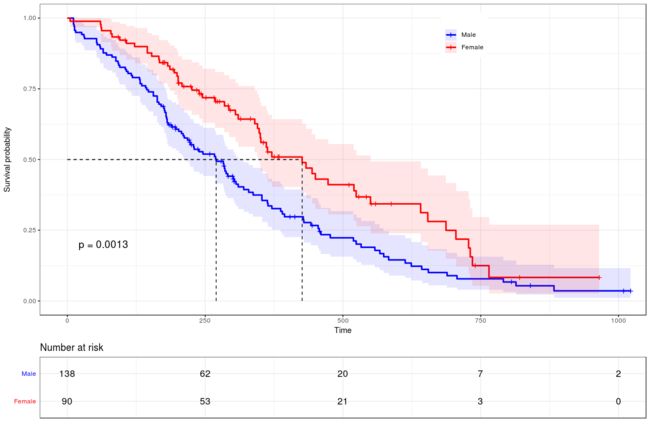
library(survival)
library(survminer)
data("lung")
fit <- survfit(Surv(time, status) ~ sex, data = lung)
ggsurvplot(fit,pval = TRUE,conf.int = T,conf.int.style="ribbon",conf.int.alpha=0.1, palette =c("blue","red"),legend.title="",legend=c(0.7,0.9),legend.labs=c("Male","Female"),surv.median.line = "hv",risk.table = TRUE,tables.height = 0.2,tables.theme = theme_cleantable(),ggtheme = theme_bw())