作业——Matplotlib
Matplotlib
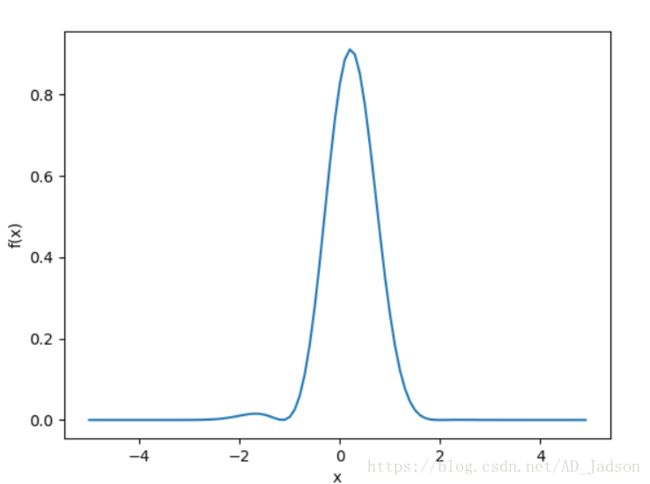
Exercise 11.1: Plotting a functionPlot the function
f(x) = [sin(x -2)]^2 *exp(-x)^2
over the interval [0; 2]. Add proper axis labels, a title, etc.
x = np.arange(-5, 5, 0.1)
y = (np.sin(x-2)**2)*np.exp(-(x**2))
plt.xlabel('x')
plt.ylabel('f(x)')
plt.plot(x, y)
plt.show()
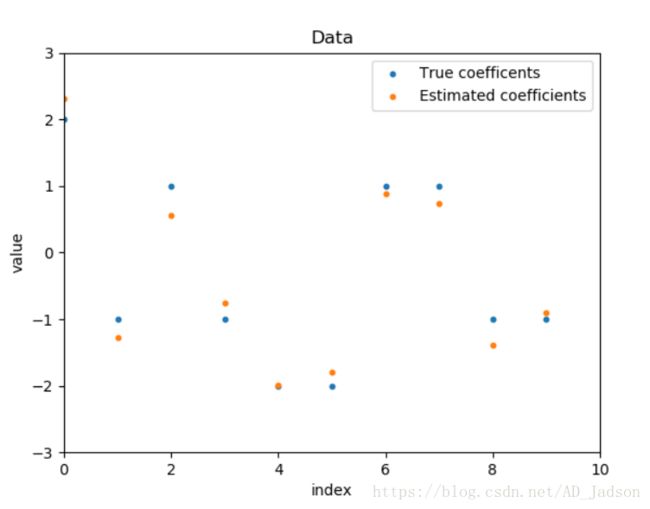
Create a data matrix X with 20 observations of 10 variables. Generate a vector b with parameters Then
generate the response vector y = Xb+z where z is a vector with standard normally distributed variables.
Now (by only using y and X), nd an estimator for b, by solving
^b = arg min ||Xb-y||2
Plot the true parameters b and estimated parameters ^b
def my_argmin(b0, X, y):
    b0 = np.reshape(b0, (10, 1))
    return np.linalg.norm(np.dot(X, b0) - y, ord=2)

#np.random.seed()
X = np.random.randint(-3, 3, (20, 10))
a = np.random.randint(-3, 3, (10, 1))
z = np.random.randn(20, 1)
y = np.dot(X, a) - z
y = np.array(y)

r = optimize.minimize(my_argmin, np.transpose(a), args=(X, y))
x = [0,1,2,3,4,5,6,7,8,9]

sca1 = plt.scatter(x, a, s = 10)
sca2 = plt.scatter(x, r.x, s = 10)
plt.xlabel('index')
plt.ylabel('value')
plt.axis([0, 10, -3, 3])
plt.title('Data')
plt.legend([sca1, sca2], ['True coefficents', 'Estimated coefficients'])
plt.show()Generate a vector z of 10000 observations from your favorite exotic distribution. Then make a plot that
shows a histogram of z (with 25 bins), along with an estimate for the density, using a Gaussian kernel
density estimator (see scipy.stats).
data = stats.norm.rvs(loc = 1, scale = 0.3, size = 10000)
plt.hist(data, bins = 25, normed = 1, edgecolor = 'black', color = 'blue')
sns.kdeplot(data, color = 'red')
plt.show()

