【时间序列 - 02】ExponentialSmoothing - 指数平滑算法
Abstract:
本文主要以实践的角度介绍指数平滑算法,包括:1)使用 ExponentialSmoothing 框架调用指数平滑算法;2)文末附有“使用python实现指数平滑算法(不确定写得对不对,T_T)”。此外,指数平滑算法的理论知识以参考链接的方式进行整理。
Reference
https://www.statsmodels.org/stable/generated/statsmodels.tsa.holtwinters.ExponentialSmoothing.html?highlight=exponentialsmoothing
指数平滑算法理论知识:
- MBA-Lib:wiki,指数平滑算法
- https://blog.csdn.net/nieson2012/article/details/51980943
Knowledge
class statsmodels.tsa.holtwinters.ExponentialSmoothing(endog, trend=None, damped=False, seasonal=None, seasonal_periods=None, dates=None, freq=None, missing='none')
Holt Winter's Exponential Smoothing
| Parameters: |
|
| Returns: |
results |
| Return type: |
ExponentialSmoothing class |
调用模型
model = ExponentialSmoothing(train, seasonal='additive', seasonal_periods = seasonal_periods).fit()
pred = model.predict(start=test.index[0], end=test.index[-1])

## fit(self, smoothing_level=None, smoothing_slope=None, smoothing_seasonal=None,
       damping_slope=None, optimized=True, use_boxcox=False, remove_bias=False,
       use_basinhopping=False)
## 若需详细了解 - 建议看源码
## https://www.statsmodels.org/stable/_modules/statsmodels/tsa/holtwinters.html#ExponentialSmoothing
smoothing_level=None     ## alpha
smoothing_slope=None     ## beta
smoothing_seasonal=None  ## gamma
damping_slope=None       ## phi value of the damped method
optimized=True           ## hould the values that have not been set above be optimized automatically?
use_boxcox=False         ## {True, False, 'log', float} log->apply log; float->lambda equal to float.
remove_bias=False        ##
use_basinhopping=False   ## Should the opptimser try harder using basinhopping to find optimal values?
调参
class ExponentialSmoothing/fit()
1. use_boxcox
-
use_boxcox = False(predict 201710~11)
-
use_boxcox = 'log'(predict 201710~11)
2. use_basinhopping
-
use_basinhopping = False
-
use_basinhopping = True
-
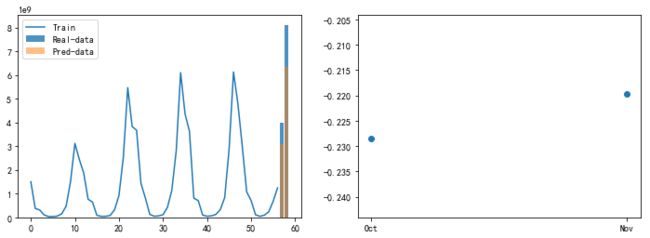
参数组合:use_basinhopping = True, use_boxcox = 'log'(predict 201710~11)
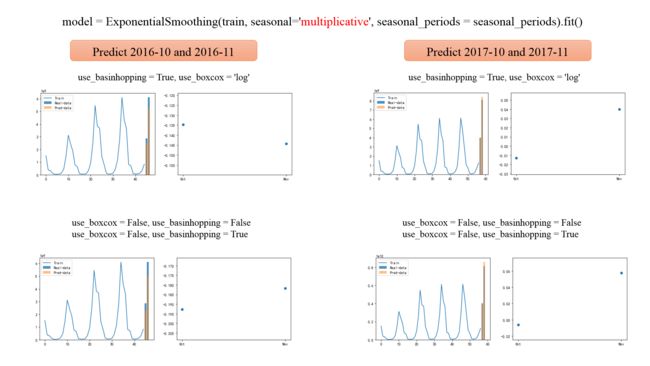
上述参数对应模型的泛化能力有待提升,当预测 201610~11时,效果相反,即 use_boxcox=False, use_basinhopping = False 这组参数的效果更好。
class ExponentialSmoothing(seasonal)
-
seasonal = "add" - "additive" ## 累乘式
-
seasonal = "mul" - "multiplicative" ## 累加式
-
seasonal = "None"
-
seasonal = "mul",use_basinhopping = True, use_boxcox = 'log' ## 效果相对更优
Source code for statsmodels.tsa.holtwinters
-
引用文件
import numpy as np

from statsmodels.base.model import Results
from statsmodels.base.wrapper import populate_wrapper, union_dicts, ResultsWrapper
from statsmodels.tsa.base.tsa_model import TimeSeriesModel

from scipy.optimize import basinhopping, brute, minimize
from scipy.spatial.distance import sqeuclidean
try:
    from scipy.special import inv_boxcox
except ImportError:
    def inv_boxcox(x, lmbda):
        return np.exp(np.log1p(lmbda * x) / lmbda) if lmbda != 0 else np.exp(x)
from scipy.stats import boxcox-
class HoltWintersResults(Results)
-
class HoltWintersResultsWrapper(ResultsWrapper)
-
class ExponentialSmoothing(TimeSeriesModel)
-
class SimpleExpSmoothing(ExponentialSmoothing)
-
class Holt(ExponentialSmoothing)
My Script - 20180716
import pandas as pd
#import numpy as np
import matplotlib.pyplot as plt
from statsmodels.tsa.holtwinters import ExponentialSmoothing
from hcq_lib import cal_error, hcq_write

month_list = ["Jan","Feb","Mar","Apr","May","June",
              "July","Aug","Sept","Oct","Nov","Dec"]

all_leaf_class_name_dict = {cate_id: cate_name}

# =============================================================================
# Meta-Parameters
# =============================================================================
seasonal = 'multiplicative'
#seasonal = 'add'
use_basinhopping = True
use_boxcox='log'
#use_boxcox=False
seasonal_periods = 12

len_pred = 2  ## 预测月数
#stop_month_list = ["2015-02", "2015-03", "2015-04", "2015-05", "2015-06", "2015-07",
#                   "2015-08", "2015-09", "2015-10", "2015-11", "2015-12"]
#
stop_month_list = ["2016-02", "2016-03", "2016-04", "2016-05", "2016-06", "2016-07",
                   "2016-08", "2016-09", "2016-10", "2016-11", "2016-12"]

#stop_month_list = ["2017-02", "2017-03", "2017-04", "2017-05", "2017-06", "2017-07",
#                   "2017-08", "2017-09", "2017-10", "2017-11", "2017-12"]
#stop_month = "2015-12"  ## format "xxxx-xx"w

log_path = "./log/statsmodels_ExponentialSmoothing.txt"

df = pd.read_csv('./dataset/cate_by_month_histroy.csv', header=0, encoding='gbk')
df.columns = ['ds', 'cate_id', 'cate_name', 'y']

for cate_id in all_leaf_class_name_dict.keys():

    cate_name = all_leaf_class_name_dict[cate_id]

    ## 传入的.csv数据是全部的历史数据
    ## 此处提供设置选取部分数据作为实验数据
    ## 如,截取包括"2017-12"之前的数据作为实验数据,然后再进行train和val数据集的切分
    error_info = ""

    for stop_month in stop_month_list:

        class_df_all = df[df.cate_name.str.startswith(cate_name)].reset_index(drop=True)
        stop_month_index = class_df_all[class_df_all.ds == stop_month].index.tolist()[0]
        print(stop_month, stop_month_index)
        class_df_all = class_df_all[:stop_month_index+1]

        len_dataset = len(class_df_all)
        train, test = class_df_all['y'][:len_dataset-len_pred], class_df_all['y'][len_dataset-len_pred:]

        ## seasonal: {"add", "mul", "additive", "multiplicative", None}
    #    model = ExponentialSmoothing(train, seasonal='additive', seasonal_periods = seasonal_periods).fit(smoothing_level=0.25)
    #    model = ExponentialSmoothing(train, seasonal='multiplicative', seasonal_periods = seasonal_periods).fit(use_boxcox=False, use_basinhopping = False)
    #    model = ExponentialSmoothing(train, seasonal='additive', seasonal_periods = seasonal_periods).fit(use_boxcox='log')
        model = ExponentialSmoothing(train, seasonal=seasonal, seasonal_periods = seasonal_periods).fit(
                use_basinhopping = use_basinhopping, use_boxcox=use_boxcox)

        pred = model.predict(start=test.index[0], end=test.index[-1])  ## 56, 59

        ## error
        error_list = cal_error(pred, test)
        for _error in error_list:
            error_info += (str(_error) + " ")

    hcq_write(log_path, True, True, "==== {} ====".format(cate_name))
    parameters_info = "seasonal = {}, use_basinhopping = {}, use_boxcox = {}, seasonal_periods = {} |||  len_pred = {}".format(
            seasonal, use_basinhopping, use_boxcox, seasonal_periods, len_pred)
    hcq_write(log_path, True, True, parameters_info)
    hcq_write(log_path, False, True, error_info)

    # =============================================================================
#    # plot
#    fig = plt.figure(facecolor='white')
#    ax = fig.add_subplot(121)
#    ax.plot(train.index, train, label='Train')
#    ax.bar(test.index, test, alpha=0.8, label='Real-data')
#    ax.bar(pred.index, pred, alpha=0.5, label='Pred-data')
#    ax.set_xlabel('Time Series of days')
#    ax.set_ylabel('GMV: Gross Merchandise Volume')
#    ax.set_title(u'{}: {} ||| predict {} month'.format(cate_name, stop_month, len_pred))
#    plt.legend(loc='best')
#
#    ax_error = fig.add_subplot(122)
#    ax_error.scatter(month_list[int(stop_month.split("-")[1])-len_pred:int(stop_month.split("-")[1])], error_list, label='error')
#
#    fig.set_size_inches(12, 4)
#    plt.savefig("./plot_history_data/{}-{}".format(cate_name, stop_month))
python:实现指数平滑算法
# -*- coding: utf-8 -*-
# @Date     : 2017-04-11 21:27:00
# @Author   : Alan Lau ([email protected])
# @Language : Python3.5
# https://blog.csdn.net/AlanConstantineLau/article/details/70173561

import numpy as np
from matplotlib import pyplot as plt
plt.rcParams['font.sans-serif']=['SimHei']
plt.rcParams['axes.unicode_minus']=False
import xlrd

all_leaf_class_name_list = ['毛针织衫', '休闲运动套装']

file_path = './dataset/target_leaf_level_0625_by_month.csv'
file = xlrd.open_workbook(file_path)
class_name_list = all_leaf_class_name_list
#alpha = 0.47     #设置alphe,即平滑系数

#指数平滑公式
def exponential_smoothing(alpha, s):
    s_out = np.zeros(len(s))
#    s_result[0] = float(s[1]+s[2]+s[3])/3
    s_out[0] = s[0]
    for i in range(1, len(s_out)):
        s_out[i] = alpha*s[i]+(1-alpha)*s_out[i-1]
    return s_out


# =============================================================================
# 循环尝试 alpha 平滑系数:横轴表示alpha,纵轴表示模型误差
# 误差计算方法:sum(所有预测值 - 所有真实值) / sum(所有真实值)
# =============================================================================
alpha_list = [x for x in np.arange(0.1, 1.0, 0.005)]

def show_data_alpha(GMV_list_true, class_name, RMSE_double_list, RMSE_triple_list, bset_alpha_double, RMSE_bset_alpha_double, bset_alpha_triple, RMSE_bset_alpha_triple):

    plt.figure(figsize=(10, 6), dpi=80)#设置绘图区域的大小和像素
    plt.plot(alpha_list, RMSE_double_list, color='red', label="double predicted, bset_alpha_double = {}, s_RMSE = {}".format(
            bset_alpha_double, RMSE_bset_alpha_double))   # 将二次指数平滑法计算的预测值的折线设置为红色

    plt.plot(alpha_list, RMSE_triple_list, color='green', label="triple predicted, bset_alpha_triple = {}, s_RMSE = {}".format(
            bset_alpha_triple, RMSE_bset_alpha_triple))   # 将三次指数平滑法计算的预测值的折线设置为绿色
    plt.legend(loc='upper left')  # 显示图例的位置,这里为左上方
    plt.title('{}_alpha_finding'.format(class_name))
    plt.ylabel('MAPE')     # y轴标签
    plt.savefig("./result_exponential_smoothing_2/{}".format(class_name + "_find_best_alpha"))

def load_data(table_sheet, data_stop_index):

    year_month_list = []
    GMV_list = []
    GMV_list_true = []
#    nrows = table_sheet.nrows
    ## row=40 --> 201803
    row = data_stop_index
    for i in range(row-1):

        year_month_list.append(table_sheet.col(0)[i+1].value)
        GMV_list.append(float(table_sheet.col(1)[i+1].value))
        GMV_list_true.append(float(table_sheet.col(1)[i+1].value))


    GMV_list_true.append(float(table_sheet.col(1)[row].value))
#    print("GMV_list_true = {}".format(GMV_list_true))
#    print(float(table_sheet.col(6)[40].value))
#    print(float(table_sheet.col(6)[41].value))
#    print(len(GMV_list))
    return year_month_list, GMV_list, GMV_list_true

# =============================================================================
# author: 初类
# date:   20180619
# 功能:基于历史数据,分别计算二次平滑指数模型和三次平滑指数模型的预测值
# 1)validation 集合:2018年2月~4月;test 集合:2018年5月
# 2)预测2018年2月份:使用2015年1月~2018年1月的历史实际数据;预测2018年3月时,引入2018年2月份的真是数据。
# =============================================================================

## data_stop_index:训练数据的截止点。如,预测2018年2月份时,data_stop指向2018年1月份
## data_stop_index = 38 --> 201801(取得到)
## data_stop_index = 39 --> 201802(取得到)

validation_month_index = [60]  ## 201802, 201803, 201804

def main():

    for class_name in class_name_list:

        ## 依次尝试每个平滑系数
        RMSE_double_list = []
        RMSE_triple_list = []

        avg_RMSE_bset_alpha_double = 999
        avg_RMSE_bset_alpha_triple = 999
        bset_alpha_double = alpha_list[0]
        bset_alpha_triple = alpha_list[0]

        for alpha in alpha_list:
#            print("alpha = {}".format(alpha))
            RMSE_double = 0
            RMSE_triple = 0

            try:
                table_sheet = file.sheet_by_name(class_name)
                for data_stop_index in validation_month_index:

                    year_month_list, GMV_list, GMV_list_true = load_data(table_sheet, data_stop_index)

# =============================================================================
#                     reference: http://wiki.mbalib.com/wiki/%E6%8C%87%E6%95%B0%E5%B9%B3%E6%BB%91%E6%B3%95
# =============================================================================
                    s_single = exponential_smoothing(alpha, GMV_list)
                    s_double = exponential_smoothing(alpha, s_single)
                    a_double = 2*s_single-s_double    # 计算二次指数平滑的a
                    b_double = (alpha/(1-alpha))*(s_single-s_double)      # 计算二次指数平滑的b
                    s_pre_double = np.zeros(s_double.shape)     # 建立预测轴

                    for i in range(0, len(GMV_list)):
                        # 循环计算每一年的二次指数平滑法的预测值,下面三次指数平滑法原理相同
                        s_pre_double[i] = a_double[i] + b_double[i]

                    pre_next_year = a_double[-1]+b_double[-1]*1         # 预测下一个月
                    s_pre_double = np.insert(s_pre_double, len(s_pre_double), values=np.array([pre_next_year]), axis=0)

                    ### 三次平滑指数
                    s_triple = exponential_smoothing(alpha, s_double)
                    a_triple = 3*s_single-3*s_double+s_triple
                    b_triple = (alpha/(2*((1-alpha)**2)))*((6-5*alpha)*s_single -2*((5-4*alpha)*s_double)+(4-3*alpha)*s_triple)
                    c_triple = ((alpha**2)/(2*((1-alpha)**2)))*(s_single-2*s_double+s_triple)
                    s_pre_triple = np.zeros(s_triple.shape)

                    for i in range(0, len(GMV_list)):
                        s_pre_triple[i] = a_triple[i]+b_triple[i]*1 + c_triple[i]*(1**2)

                    pre_next_year = a_triple[-1]+b_triple[-1]*1 + c_triple[-1]*(1**2)
                    s_pre_triple = np.insert(s_pre_triple, len(s_pre_triple), values=np.array([pre_next_year]), axis=0)

=============================================================================
                    # 计算误差
                    # =============================================================================
                    final_month_num = -1
                    sum_ture_test = np.sum(GMV_list_true[final_month_num])
#                    print("[alpha = {}] sum_ture_test = {}, s_pre_double = {}, s_pre_triple = {}".format(
#                            round(alpha, 2), sum_ture_test, s_pre_double[final_month_num], s_pre_triple[final_month_num]))
                    RMSE_double += ((np.sum((s_pre_double[final_month_num] - GMV_list_true[final_month_num])**2))**0.5)/sum_ture_test
                    RMSE_triple += ((np.sum((s_pre_triple[final_month_num] - GMV_list_true[final_month_num])**2))**0.5)/sum_ture_test

                RMSE_double = round(RMSE_double/len(validation_month_index), 8)
                RMSE_triple = round(RMSE_triple/len(validation_month_index), 8)
#                print("RMSE_double = {}, RMSE_triple = {}".format(RMSE_double, RMSE_triple))

                if RMSE_double < avg_RMSE_bset_alpha_double:
                    avg_RMSE_bset_alpha_double = RMSE_double
                    bset_alpha_double = round(alpha, 2)

                if RMSE_triple < avg_RMSE_bset_alpha_triple:
                    avg_RMSE_bset_alpha_triple = RMSE_triple
                    bset_alpha_triple = round(alpha, 2)

                RMSE_double_list.append(RMSE_double)
                RMSE_triple_list.append(RMSE_triple)

            except Exception as e:
                print("except [{}] {}".format(class_name, e))

        ## show plot
        show_data_alpha(GMV_list_true, class_name, RMSE_double_list, RMSE_triple_list,
                        bset_alpha_double, avg_RMSE_bset_alpha_double, bset_alpha_triple, avg_RMSE_bset_alpha_triple)

if __name__ == '__main__':
    main()


