Matplotlib绘制漫威英雄战力图,带你飞起来!
↑ 关注 + 置顶 ~ 别错过小z的干货内容
![]()
一、前言
我们平常玩游戏或者看电影的时候,会看到里面介绍各种人的能力指标。
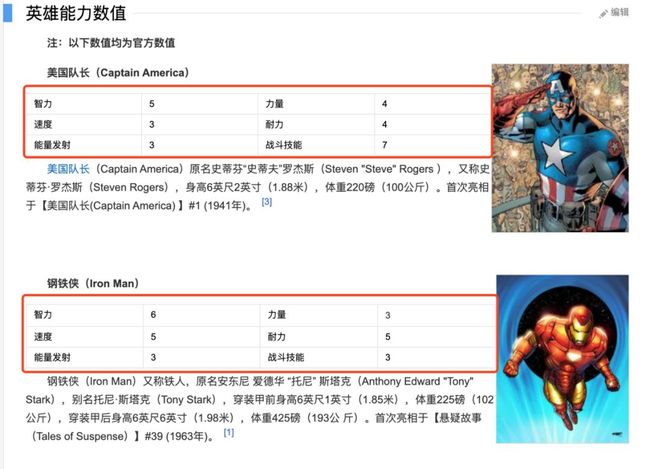
以百度百科提供的漫威人物能力数值为例,如下图:

分别介绍了各个超级英雄的智力、力量、速度、耐力、能量发射、战斗技能。
但是吧,光是这样的表格,并不能很直观的看出英雄的能力,我们需要一个战斗力分布图。
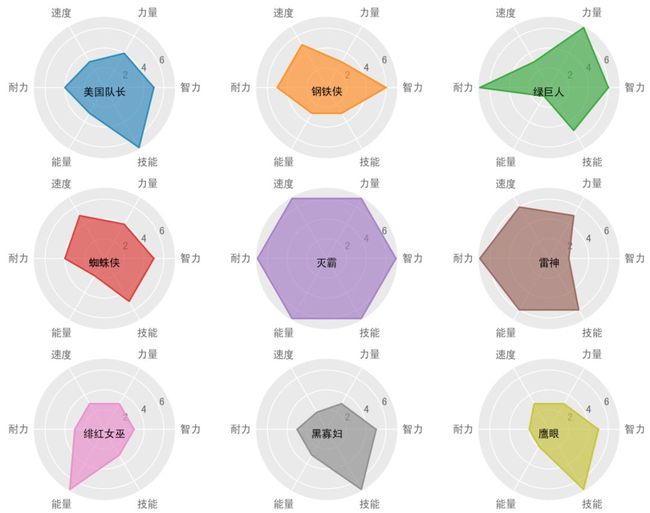
话不多说,先上成品:

二、期望功能
传入战力指标、超级英雄能力数值,生成上面的战力分布图。
能力指标 = ['智力', '力量', '速度', '耐力', '能量', '技能']
超级英雄能力值 = {
    '美国队长': [5, 4, 3, 4, 3, 7],
    '钢铁侠': [6, 3, 5, 5, 3, 3],
    '绿巨人': [6, 7, 3, 7, 1, 5],
    '蜘蛛侠': [5, 4, 5, 4, 2, 5],
    '灭霸': [7, 7, 7, 7, 7, 7],
    '雷神': [2, 5, 6, 7, 6, 6],
    '绯红女巫': [3, 3, 3, 3, 7, 3],
    '黑寡妇': [5, 3, 2, 3, 3, 7],
    '鹰眼': [5, 3, 3, 2, 2, 7],
}
生成战力图(能力指标,超级英雄能力值)
三、代码实现
talking is cheap,show you the code.
因为涉及到显示中文,依赖字体,把代码上传到了github:chenqionghe/generate-ability-map[1]。
完美的实现了需求,使用简单粗暴,真可谓高端大气上档次。
调用如下:
abilities = ['智力', '力量', '速度', '耐力', '能量', '技能']
super_heros = {
    '美国队长': [5, 4, 3, 4, 3, 7],
    '钢铁侠': [6, 3, 5, 5, 3, 3],
    '绿巨人': [6, 7, 3, 7, 1, 5],
    '蜘蛛侠': [5, 4, 5, 4, 2, 5],
    '灭霸': [7, 7, 7, 7, 7, 7],
    '雷神': [2, 5, 6, 7, 6, 6],
    '绯红女巫': [3, 3, 3, 3, 7, 3],
    '黑寡妇': [5, 3, 2, 3, 3, 7],
    '鹰眼': [5, 3, 3, 2, 2, 7],
}
generate_ability_map(abilities, super_heros)
核心功能代码如下:
import numpy as np
import matplotlib.pyplot as plt
import math
import matplotlib.colors as mcolors

# 导入中文
import matplotlib.font_manager as font_manager

font_dirs = ['./font']
font_files = font_manager.findSystemFonts(fontpaths=font_dirs)
font_list = font_manager.createFontList(font_files)
font_manager.fontManager.ttflist.extend(font_list)
plt.rcParams['font.family'] = 'SimHei'

# 启用主题
plt.style.use('ggplot')

# 获取极径范围
def get_range(data_list):
    max = min = 0
    for _, data in data_list.items():
        for v in data:
            if v < min:
                min = v
            if v > max:
                max = v
    return [min, max]

# 生成能力分布图
def generate_ability_map(abilities, data_list, rows=3):
    min, max = get_range(data_list)
    # 根据能力项等分圆
    angles = np.linspace(0, 2 * np.pi, len(abilities), endpoint=False)
    angles = np.append(angles, angles[0])
    # 生成n个子图
    fg, axes = plt.subplots(math.ceil(len(data_list) / rows), rows, subplot_kw=dict(polar=True))
    # 调整子图间距
    plt.subplots_adjust(wspace =0.6, hspace =0.6)
    # 打散为一维数组
    axes = axes.ravel()
    # 获取所有支持的颜色
    colors = list(mcolors.TABLEAU_COLORS)
    # 循环绘制
    i = 0
    for name, data in data_list.items():
        data = np.append(np.array(data), data[0])
        ax = axes[i]
        # 绘制线条
        ax.plot(angles, data, color=colors[i])
        # 填充颜色
        ax.fill(angles, data, alpha=0.7, color=colors[i])
        # 设置角度
        ax.set_xticks(angles)
        # 设置坐标轴名称
        ax.set_xticklabels(abilities)
        # 设置名称
        ax.set_title(name, size=10, color='black', position=(0.5, 0.4))
        # 设置极径最小值
        ax.set_rmin(min)
        # 设置极径最大值(最大值加0.1,要不线条最外圈线显示不完全)
        ax.set_rmax(max + 0.1)
        i = i + 1
    plt.show()
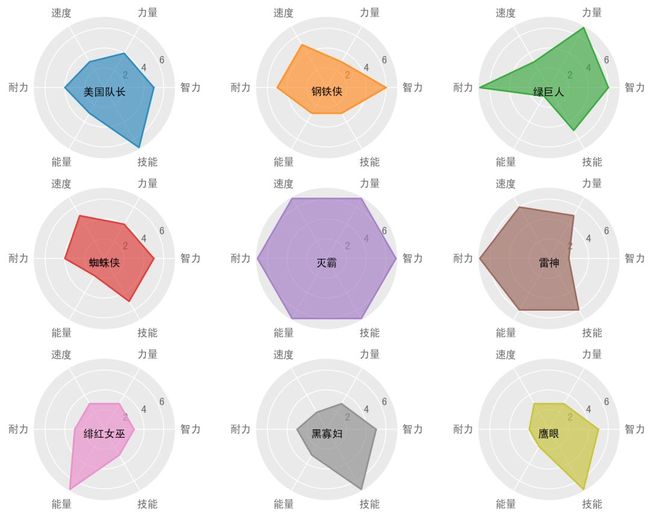
输出:
下面是对代码的解释:
1、导入matplotlib依赖包
import numpy as np
import matplotlib.pyplot as plt
import math
import matplotlib.colors as mcolors
关于matplotlib的使用,可以看官方文档[2]
2、支持显示中文
# 导入中文
import matplotlib.font_manager as font_manager
font_dirs = ['./font']
font_files = font_manager.findSystemFonts(fontpaths=font_dirs)
font_list = font_manager.createFontList(font_files)
font_manager.fontManager.ttflist.extend(font_list)
plt.rcParams['font.family'] = 'SimHei'
关于如果显示中文,可以查看Matplotlib如何显示中文[3]
3、使用ggplot主题
plt.style.use('ggplot')
matplot内置了很多主题,ggplot这个优雅,就是它了!
下面就是对生成最终图generate_ability_map函数的步骤分解。
4、根据能力项等分圆
angles = np.linspace(0, 2 * np.pi, len(abilities), endpoint=False)
angles = np.append(angles, angles[0])
5、生成n个子图
# row默认为3,代表一行分布3个图,也可以指定参数自定义
fg, axes = plt.subplots(math.ceil(len(data_list) / rows), rows, subplot_kw=dict(polar=True))
# 调整子图间距
plt.subplots_adjust(wspace =0.6, hspace =0.6)
# 打散为一维数组
axes = axes.ravel()
默认生成的是二维矩阵,我们需要调用ravel转换为一维,便于遍历
6、获取支持的颜色
# 获取所有支持的颜色
colors = list(mcolors.TABLEAU_COLORS)
如果不指定颜色,就不能产生这么好看的图了 关于颜色的使用可以查看:官方颜色帮助[4]
7、绘制所有子图
# 循环绘制
     i = 0
for name, data in data_list.items():
    data = np.append(np.array(data), data[0])
    ax = axes[i]
    # 绘制线条
    ax.plot(angles, data, color=colors[i])
    # 填充颜色
    ax.fill(angles, data, alpha=0.7, color=colors[i])
    # 设置角度
    ax.set_xticks(angles)
    # 设置坐标轴名称
    ax.set_xticklabels(abilities)
    # 设置名称
    ax.set_title(name, size=10, color='black', position=(0.5, 0.4))
    # 设置极径最小值
    ax.set_rmin(min)
    # 设置极径最大值(最大值加0.1,要不线条最外圈线显示不完全)
    ax.set_rmax(max + 0.1)
    i = i + 1
plt.show()
根据数据列表,分别绘制线条,设置角度和数值,坐标轴名称等,最终将所有的英雄显示出来。
axes对象有很多可以自定义显示的方法,详情可以查看:官方文档axes[5]
四、更多示例
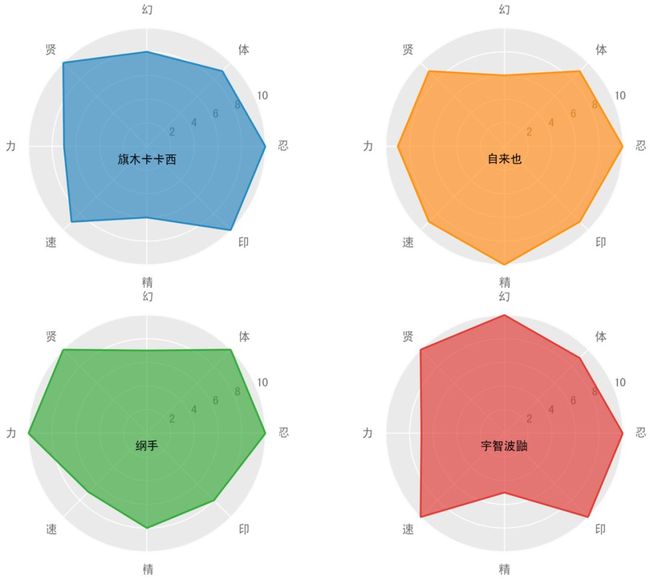
显示火影人物指标,数据来源于百度百科:火影忍者:秘传·者之书。

调用代码:
abilities = ['忍', '体', '幻', '贤', '力', '速', '精', '印']
super_heros= {
    '旗木卡卡西': [10, 9, 8, 10, 7, 9, 6, 10],
    '自来也': [10, 9, 6, 9, 9, 9, 10, 9],
    '纲手': [10, 10, 7, 10, 10, 7, 8, 8],
    '宇智波鼬': [10, 9, 10, 10, 7, 10, 5, 10],
}
generate_ability_map(abilities,super_heros, 2)
参考资料
[1]
chenqionghe/generate-ability-map: https://github.com/chenqionghe/generate-ability-map
[2]官方文档: https://matplotlib.org/
[3]Matplotlib如何显示中文: https://www.cnblogs.com/chenqionghe/p/12317549.html
[4]官方颜色帮助: https://matplotlib.org/3.1.0/gallery/color/named_colors.html
[5]官方文档axes: https://matplotlib.org/api/axes_api.html?highlight=axes#module-matplotlib.axes
作者:雪山飞猪
来源:https://www.cnblogs.com/chenqionghe/
延伸阅读
    快跑!数据他又来唬人了!    Pandas熟练?进来测测这50道题吧!    实战解读:数据分析,如何更进一步?
小z读者群已经建立,后台回复“入群”,即可加入有趣讨论,交流数据干货

