用Sklearn自带Digits数据集通过SVM训练识别手写体
一. 预测模型的建立
- Digits数据集的一些介绍
#输出数据集的简介、作者以及参考资料
print(digits.DESCR)
部分输出:
Optical Recognition of Handwritten Digits Data Set
Notes
Data Set Characteristics:
:Number of Instances: 5620
:Number of Attributes: 64
:Attribute Information: 8x8 image of integer pixels in the range 0…16.
:Missing Attribute Values: None
:Creator: E. Alpaydin (alpaydin ‘@’ boun.edu.tr)
:Date: July; 1998
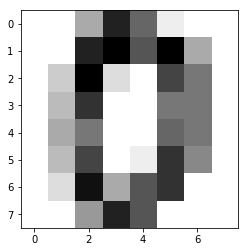
该数据集是1797张8*8像素大小的灰度图
显示第一张图片
digits.images[0]
输出:
array([[ 0., 0., 5., 13., 9., 1., 0., 0.],
[ 0., 0., 13., 15., 10., 15., 5., 0.],
[ 0., 3., 15., 2., 0., 11., 8., 0.],
[ 0., 4., 12., 0., 0., 8., 8., 0.],
[ 0., 5., 8., 0., 0., 9., 8., 0.],
[ 0., 4., 11., 0., 1., 12., 7., 0.],
[ 0., 2., 14., 5., 10., 12., 0., 0.],
[ 0., 0., 6., 13., 10., 0., 0., 0.]])
#灰度图像
import matplotlib.pyplot as plt
%matplotlib inline
plt.imshow(digits.images[0],cmap = plt.cm.gray_r,interpolation = 'nearest')
#图像目标值
digits.target
输出:
array([0, 1, 2, …, 8, 9, 8])
#数据集大小
digits.target.size
输出:
1797
- 完整代码
from sklearn import svm
svc = svm.SVC(gamma = 0.001,C = 100)
from sklearn import datasets
digits = datasets.load_digits()

import matplotlib.pyplot as plt
%matplotlib inline

plt.subplot(321)
plt.imshow(digits.images[1791],cmap = plt.cm.gray_r,interpolation = 'nearest')
plt.subplot(322)
plt.imshow(digits.images[1792],cmap = plt.cm.gray_r,interpolation = 'nearest')
plt.subplot(323)
plt.imshow(digits.images[1793],cmap = plt.cm.gray_r,interpolation = 'nearest')
plt.subplot(324)
plt.imshow(digits.images[1794],cmap = plt.cm.gray_r,interpolation = 'nearest')
plt.subplot(325)
plt.imshow(digits.images[1795],cmap = plt.cm.gray_r,interpolation = 'nearest')
plt.subplot(326)
plt.imshow(digits.images[1796],cmap = plt.cm.gray_r,interpolation = 'nearest')

svc.fit(digits.data[1:1790], digits.target[1:1790])

print("实际数字:",digits.target[1791:])
print("预测数字:",svc.predict(digits.data[1791:]))
运行结果:
实际数字: [4 9 0 8 9 8]
预测数字: [4 9 0 8 9 8]

二. 预测上传图像
- 图像灰度处理
import matplotlib.image as mpimg
import numpy as np
#转为灰度图像
def rgb2gray(rgb):
    return np.dot(rgb[...,:3],[0.299,0.587,0.114])

img = mpimg.imread('guess.jpg')
gray = rgb2gray(img)
#将灰度等级压缩到0~15
a = (16 - gray/16).astype(int)
plt.imshow(a, cmap = plt.get_cmap('gray_r'))
plt.show()
print("scource data in 8*8:\n",a)
运行结果:

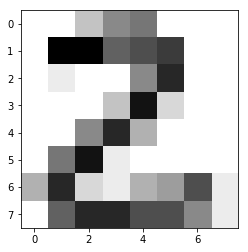
scource data in 8*8:
[[ 0 0 3 6 7 0 0 0]
[ 0 13 13 8 9 10 0 0]
[ 0 1 0 0 6 11 0 0]
[ 0 0 0 3 12 2 0 0]
[ 0 0 6 11 4 0 0 0]
[ 0 7 12 1 0 0 0 0]
[ 4 11 2 1 4 5 9 1]
[ 0 8 11 11 9 9 6 1]]
- 预测
svc.predict(a.reshape(1,-1))
结果:
array([2])
