tensorboard详解
1.填写普通的cnn网络 制作普通的网络
# coding=UTF-8

import warnings
warnings.filterwarnings('ignore')  # 不打印 warning

import tensorflow as tf

# 设置GPU按需增长
config = tf.ConfigProto()
config.gpu_options.allow_growth = True
sess = tf.Session(config=config)

import numpy as np
import  os
import  shutil
log_dir = '../summary/graph'
if os.path.exists(log_dir):
    shutil.rmtree(log_dir) # delete the summary before
os.makedirs(log_dir)
print('created log_dir path:')


#用tf导入数据
from tensorflow.examples.tutorials.mnist import input_data
mnist = input_data.read_data_sets('../data/MNIST_data',one_hot=True)


# layer definition
def conv_layer(input,channels_in,channels_out):
    w = tf.Variable(tf.zeros([5,5,channels_in,channels_out]))
    b = tf.Variable(tf.zeros([channels_out]))
    conv = tf.nn.conv2d(input,w,strides=[1,1,1,1],padding="SAME")
    act = tf.nn.relu(conv + b)
    return act

# and a fully connected layer
def fc_layer(input,channels_in,channels_out):
    w = tf.Variable(tf.zeros([channels_in,channels_out]))
    b = tf.Variable(tf.zeros([channels_out]))
    act = tf.nn.relu(tf.matmul(input,w) + b)
    return  act


#### feed-forward setup
# setup placeholders , and reshape the data
x = tf.placeholder(tf.float32,shape=[None,784])
y = tf.placeholder(tf.float32,shape=[None,10])
x_image = tf.reshape(x,[-1,28,28,1])


# create the network
conv1 = conv_layer(x_image,1,32)
pool1 = tf.nn.max_pool(conv1,ksize=[1,2,2,1],strides=[1,2,2,1],padding="SAME")

conv2 = conv_layer(pool1,32,64)
pool2 = tf.nn.max_pool(conv2,ksize=[1,2,2,1],strides=[1,2,2,1],padding="SAME")
flatterned = tf.reshape(pool2,[-1,7*7*64])

fc1 = fc_layer(flatterned, 7*7*64, 1024)
logits = fc_layer(fc1,1024,10)

#### loss & training
# compute cross entropy as our loss function
cross_entropy = tf.reduce_mean(
    tf.nn.softmax_cross_entropy_with_logits(logits=logits,labels=y))

# use an adamoptimizer to train the network
train_step = tf.train.AdadeltaOptimizer(1e-4).minimize(cross_entropy)

# compute the accuracy
correction_prediction = tf.equal(tf.argmax(logits,1),tf.argmax(y,1))
accuracy = tf.reduce_mean(tf.cast(correction_prediction,tf.float32))


##writer started :start to appear the graph
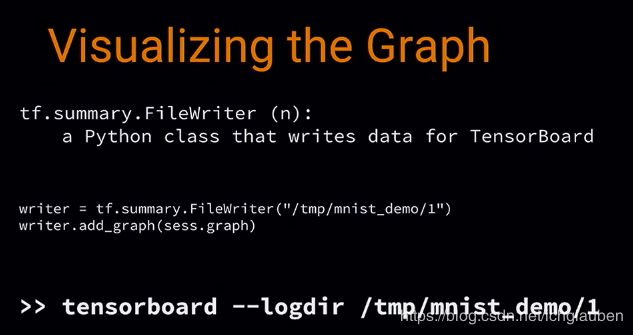
writer = tf.summary.FileWriter("../summary/mnist_demo/1")
writer.add_graph(sess.graph)

#### train the model
# initialize all the variables
sess.run(tf.global_variables_initializer())

# train for 2000 step
for i in range(2000):
    X_batch,y_batch = mnist.train.next_batch(batch_size=100)

    cost,acc,_ = sess.run([cross_entropy,accuracy,train_step],feed_dict={x:X_batch,y:y_batch})
    # occasionally report accuracy
    if i % 500 == 0:
        test_cost , test_acc = sess.run([cross_entropy,accuracy],feed_dict={x:mnist.test.images,y:mnist.test.labels})
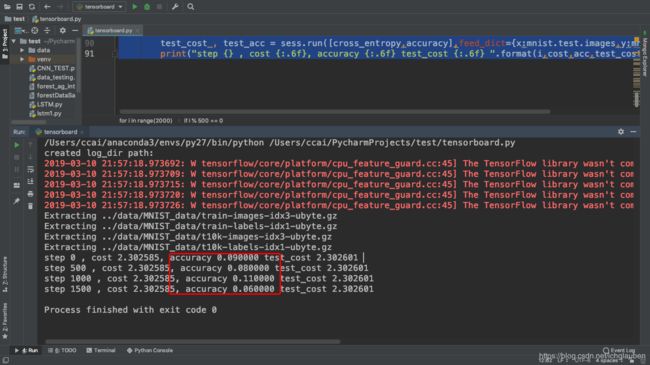
        print("step {} , cost {:.6f}, accuracy {:.6f} test_cost {:.6f} ".format(i,cost,acc,test_cost,test_acc))
接下来将分为以下几步:
- step 1: 查看 graph 结构
- step 2:查看 accuracy,weights,biases
- step 3: 修改 code
- step 4: 选择最优模型
- step 5: 用 embedding 进一步查看 error 出处
step 1: 查看 graph 结构
- 想要可视化 graph,就先只传一个 graph 进去
graph 是基于 naming system,它有 ops,ops 有 names
我们可以给某些具体的 node 特有的 name:
- Node names
- Name scopes
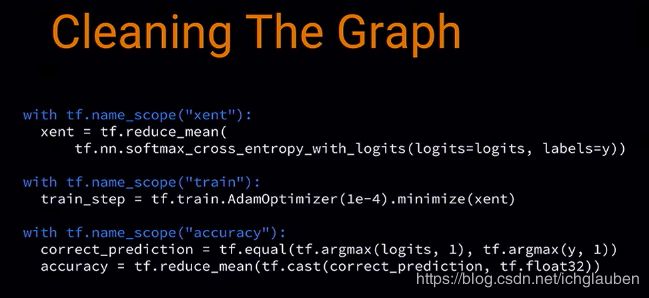
首先给一些重要 ops 赋予 name,如 weights 和 bias,
然后用 name scope ,这样所有的命名后的 ops 都会保持一个整洁的结构

接着给placeholder名称:

把这个 clean 后的存到 另外一个文件夹
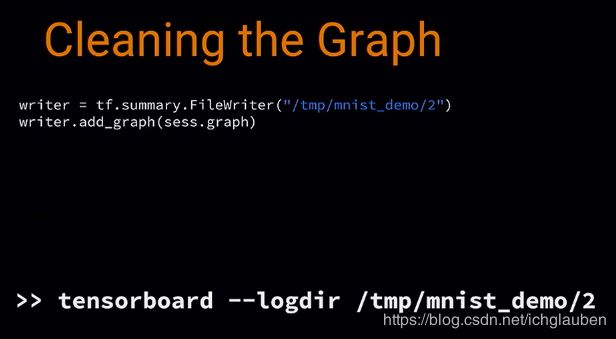
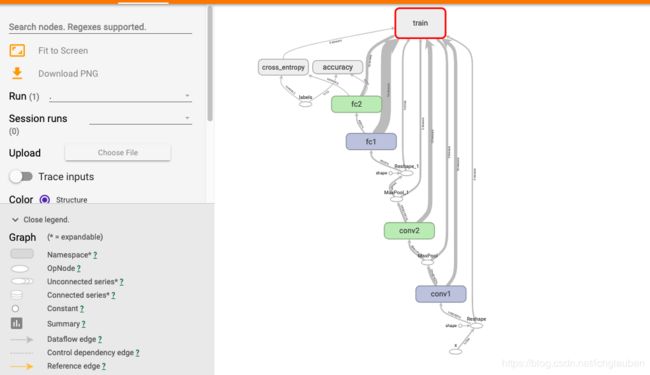
这一次的 graph 就会比较清晰:
- 有个 training block,连接着需要训练的参数,因为当你计算 gradients 时,就会用到相关的 variables
- 我们在代码中,先是有 x 的 placeholder,然后 reshape 了一下,
- 接着我们可以看一下 convolution layer
- 这样我们就可以看到,图里的结构和我们期望的是一样的
- 这里我们看到 cross entropy 是如何进行的

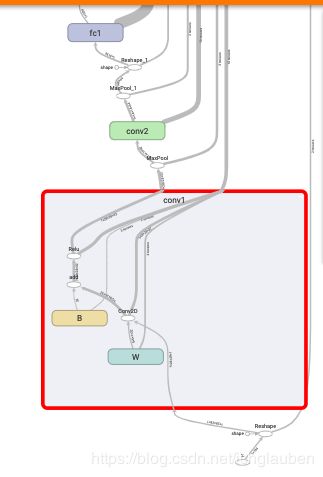
step 2:查看 accuracy,weights,biases
接下来我们需要用到 summaries:
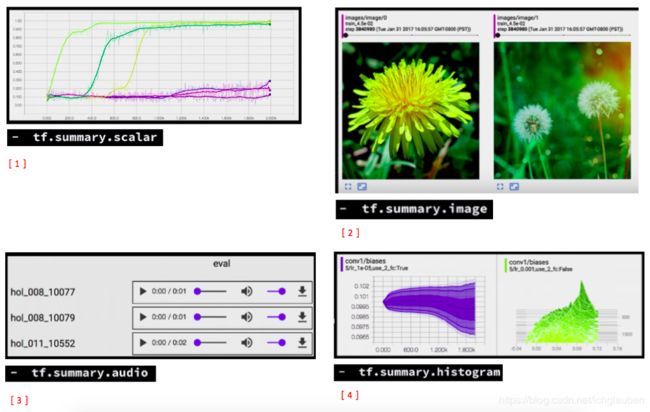
- summary 就是一个 tf op,它会从你的 graph 里面提取一个 regular tensor,然后后产生一个 protocol buffers
- 一种是 scalar,是针对单一变量的
- 还有 image 的可以输出 image,可以用来检查是否 data 是否是正确的格式
- 还可以看生成的 音频数据
- histogram 可以看数据的分布
- 还有一个 tensor summary,可以用来看任何东西,因为 tf 中的所有都是 tensor 形式的
-
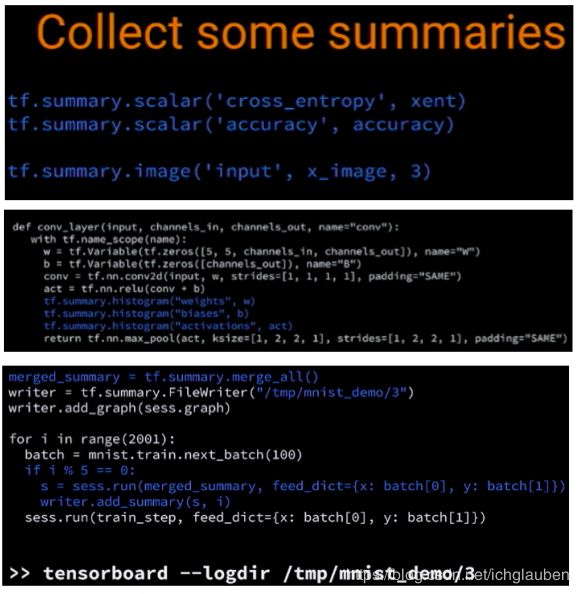
next time we will add some summaries:
-
1.例如来看 cross entropy 和 accuracy 是怎么随时间变化的,
-
2.还可以看我们的 input 是不是 MNIST 数据
-
3.还可以加一些 add 一些 histogram,来看 weights,biases,activations,
-
4.我们运行 summary op,然后得到 protocol buffers,
-
5.然后写入 disk
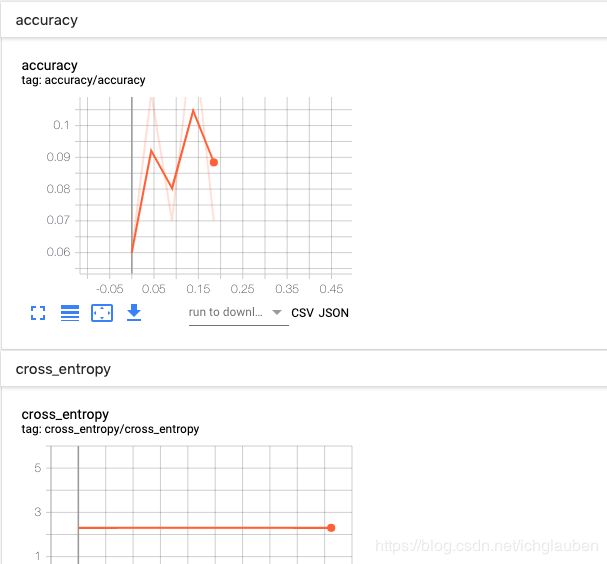
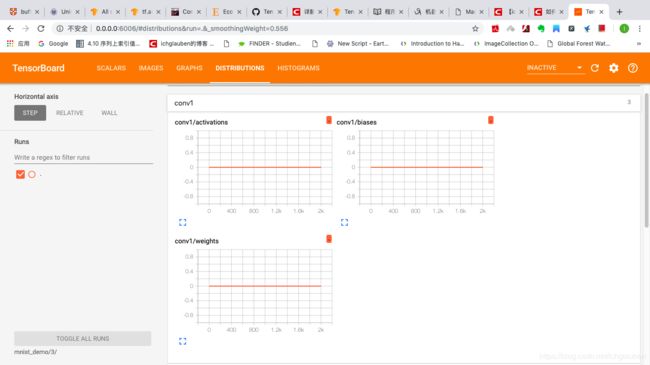
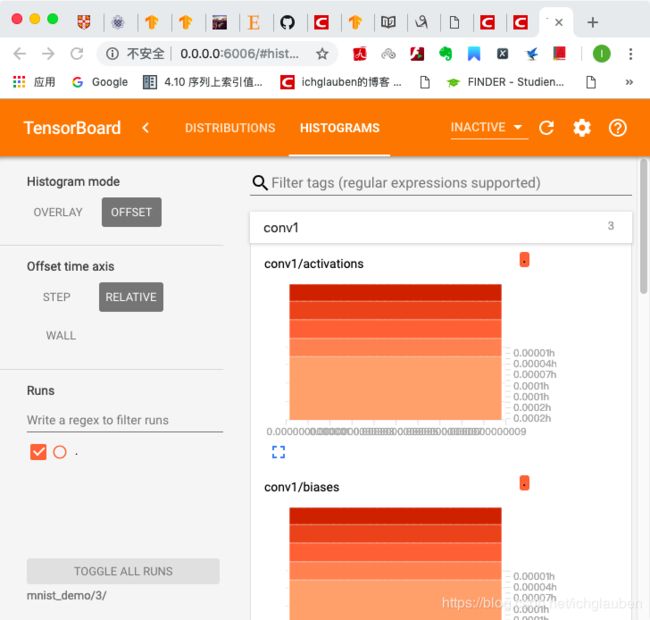
- 让我们来看看 这一层 怎么了
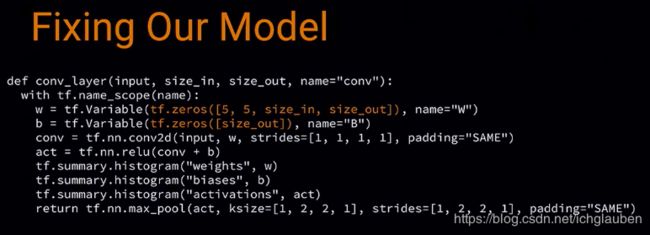
step 3: 修改 code
我们看到 weights 和 bias 被 初始化成 0 了

step 4: 选择最优模型
-
接下来 tf 还可以进行调参
-
可以看不同版本的 model 在 训练不同的 variable 时哪个更好。
-
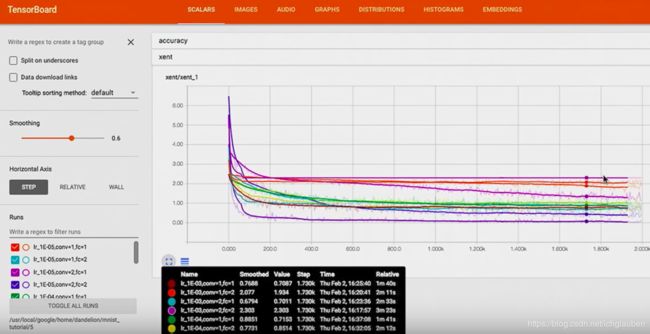
我们要尝试 不同的 learning rates,不同的 convolutional 层,
-
建立一个 hyperparameter string,然后在打开 board 时指向了上一层文件夹,这样可以比较不同的具体的结果:
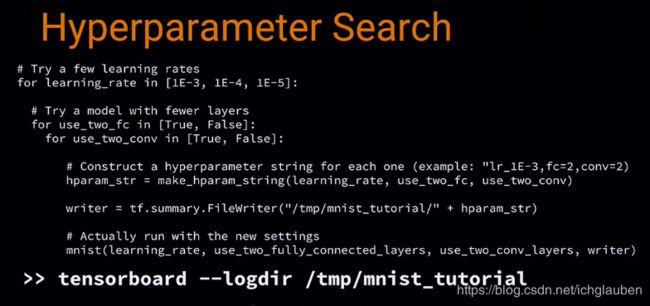
在左下角这里可以看到不同的 hyperparameter 设置:

然后可以看到,cross entropy 在不同的 超参数下是怎样的走势
step 5: 用 embedding 进一步查看 error 出处
-
接下来是最酷的功能,embedding 可视化,它可以把高维数据映射到 3D
-
我们有了 input,然后经过 NN,embedding 就是我们的 NN 是如何处理信息的 表现
-
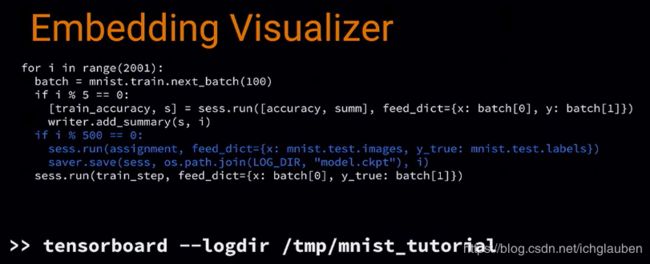
我们需要建立 variable 来装测试集的每个 image 的 embedding,
-
然后建立 config,用来知道哪里可以找到每个 MNIST 的 sprite 图片,这样就可以在浏览器看到缩略图了,并用 label 把它们组织起来
用 filewrite 写入 disk,每 500 步保存一个 model checkpoint,包含所有的 variables,包括 embedding 的
这样可以看到测试集的 1024 个数据,
我们现在用的 PCA,选了 top 3 的主成分,然后展示了 3D 的表示图,
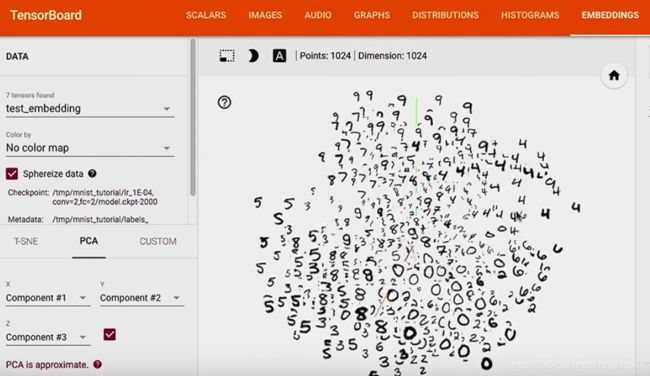
color by label 后,可以看到我们的 model 分类的比较不错哦,
例如 1 都聚到了一起,因为 1 就是 1,没有和它比较容易混淆的数字

参考链接
