python绘图
原文链接
文章目录
- hist (直方图)
- jointplot
- rugplot
- kdeplot
- distplot
- boxplot
- bar(柱状图)
- subplot
- twinx()
- curve_fit
# Populating the interactive namespace from numpy and matplotlib


import seaborn as sns
import numpy as np
from numpy.random import randn
import matplotlib as mpl
import matplotlib.pyplot as plt
from scipy import stats


# style set 这里只是一些简单的style设置
sns.set_palette('deep', desat=.6)
sns.set_context(rc={'figure.figsize': (8, 5) } )
np.random.seed(1425)
# figsize是常用的参数.
hist (直方图)
data = randn(75)
plt.hist(data)


(array([  2.,   5.,   4.,  10.,  12.,  16.,   7.,   7.,   6.,   6.]),
 array([-2.04713616, -1.64185099, -1.23656582, -0.83128065, -0.42599548,
        -0.02071031,  0.38457486,  0.78986003,  1.1951452 ,  1.60043037,
         2.00571554]),
 <a list of 10 Patch objects>)
![]()
jointplot
# 上面的多总体hist 还是独立作图, 并没有将二者结合,
# 使用jointplot就能作出联合分布图形, 即, x总体和y总体的笛卡尔积分布
# 不过jointplot要限于两个等量总体.

# jointplot还是非常实用的, 对于两个连续型变量的分布情况, 集中趋势能非常简单的给出.
# 比如下面这个例子
x = stats.gamma(2).rvs(5000)
y = stats.gamma(50).rvs(5000)
with sns.axes_style("dark"):
    sns.jointplot(x, y, kind="hex")
![]()
# 下面用使用真实一点的数据作个dmeo
import pandas as pd
from pandas import read_csv

df = read_csv("test.csv", index_col='index')
df[:2]
| department | typecity | product | credit | ddate | month_repay | apply_amont | month_repay_real | amor | tst_amount | salary_net | LTI | DTI | pass | deny | |
|---|---|---|---|---|---|---|---|---|---|---|---|---|---|---|---|
| index | |||||||||||||||
| 13652622 | gedai | ordi | elite | CR8 | 2015/5/29 12:27 | 2000 | 40000 | 1400.90 | 36 | 30000 | 1365.30 | 21.973193 | 0.610366 | 1 | 0 |
| 13680088 | gedai | ordi | xinxin | CR16 | 2015/6/3 18:38 | 8000 | 100000 | 3589.01 | 36 | 70000 | 3598.66 | 19.451685 | 0.540325 | 1 | 0 |
clean_df = df[df['salary_net'] < 10000]


sub_df = pd.DataFrame(data=clean_df, columns=['salary_net', 'month_repay'] )

with sns.axes_style("dark"):
    sns.jointplot('salary_net', 'month_repay', data=sub_df, kind="hex")
    plt.ylim([0, 10000])
    plt.xlim([0, 10000])
![]()
注: jointplot除了作图, 还会给出x, y的相关系数(pearson_r) 和r = 0 的假设检验p值. [详细参考资料](https://blog.csdn.net/qq_42554007/article/details/82625118)
rugplot
# rugplot
# rugplot 是比Histogram更加直观的 "Histogram"
data = randn(80)
plt.hist(data, alpha=0.3, color='#ffffff')
sns.rugplot(data)


<matplotlib.axes._subplots.AxesSubplot at 0x226826a0>
![]()
kdeplot
# 比较bw(bandwidth) 作用

pal = sns.blend_palette([sns.desaturate("royalblue", 0), "royalblue"], 5)
bws = [.1, .25, .5, 1, 2]

for bw, c in zip(bws, pal):
    sns.kdeplot(data, bw=bw, color=c, lw=1.8, label=bw)

plt.legend(title="kernel bandwidth value")
sns.rugplot(data, color="#CF3512")


<matplotlib.axes._subplots.AxesSubplot at 0x225db9b0>
![]()
# 比较不同的kernels
kernels = ["biw", "cos", "epa", "gau", "tri", "triw"]

for k, c in  zip(kernels, pal):
    sns.kdeplot(data, kernel=k, color=c, label=k)
plt.legend()


<matplotlib.legend.Legend at 0x225db278>
![]()
# 利用kdeplot来确定两个sample data 是否来自于同一总体
f, (ax1, ax2) = plt.subplots(2, 1, sharex=True, figsize=(8, 6))
c1, c2, c3 = sns.color_palette('Set1', 3)

dist1, dist2, dist3 = stats.norm(0, 1).rvs((3, 100))
dist3 = pd.Series(dist3 + 2, name='dist3')

# dist1, dist2是两个近似正态数据, 拥有相同的中心和摆动程度
sns.kdeplot(dist1, shade=True, color=c1, ax=ax1)
sns.kdeplot(dist2, shade=True, color=c2, label='dist2', ax=ax1)

# dist3 分布3 是另一个近正态数据, 不过中心为2.
sns.kdeplot(dist1, shade=True, color=c2, ax=ax2)
sns.kdeplot(dist3, shade=True, color=c3, ax=ax2)


<matplotlib.axes._subplots.AxesSubplot at 0x2461a240>
![]()
# 更多的还是用来画二维数据的density plot
sns.kdeplot(data.X, data.Y, shade=True, bw="silverman", gridsize=50, clip=(-11, 11))

# gridsize参数用来指定grid尺寸
# cut clip 参数类似之前提到过的
# cmap则是用来color map映射, 相当于一个color小帽子(mask)


<matplotlib.axes._subplots.AxesSubplot at 0x2768f240>
![]()
distplot
# distplot 简版就是hist 加上一根density curve
sns.set_palette("hls")
mpl.rc("figure", figsize=(9, 5))
data = randn(200)
sns.distplot(data)


<matplotlib.axes._subplots.AxesSubplot at 0x25eb34e0>
![]()
boxplot
# 这个时候 2个sample分布就不像了...
#    boxplot violinplot 常常用来 比较 一个分组(离散) X 一个连续变量的各组差异

# 因此若有DataFrame结构, 要尽量学着使用groupby操作.

y = np.random.randn(200)
g = np.random.choice(list('abcdef'), 200)
for i, l in enumerate('abcdef'):
    y[g == l] += i // 2

df = pd.DataFrame(dict(score=y, group=g))
sns.boxplot(df.score, df.group)


<matplotlib.axes._subplots.AxesSubplot at 0x2908fe80>
![]()
bar(柱状图)
# 创建一个点数为 8 x 6 的窗口, 并设置分辨率为 80像素/每英寸
plt.figure(figsize=(10, 10), dpi=80)
# 再创建一个规格为 1 x 1 的子图
# plt.subplot(1, 1, 1)
# 柱子总数
N = 10
# 包含每个柱子对应值的序列
values = (56796,42996,24872,13849,8609,5331,1971,554,169,26)
# 包含每个柱子下标的序列
index = np.arange(N)
# 柱子的宽度
width = 0.45
# 绘制柱状图, 每根柱子的颜色为紫罗兰色
p2 = plt.bar(index, values, width, label="num", color="#87CEFA")
# 设置横轴标签
plt.xlabel('clusters')
# 设置纵轴标签
plt.ylabel('number of reviews')
# 添加标题
plt.title('Cluster Distribution')
# 添加纵横轴的刻度
plt.xticks(index, ('mentioned1cluster', 'mentioned2cluster', 'mentioned3cluster', 'mentioned4cluster', 'mentioned5cluster', 'mentioned6cluster', 'mentioned7cluster', 'mentioned8cluster', 'mentioned9cluster', 'mentioned10cluster'))
# plt.yticks(np.arange(0, 10000, 10))
# 添加图例
plt.legend(loc="upper right")
plt.show()
subplot
import matplotlib.pyplot as plt
import numpy as np
#通过对象绘图
fig=plt.figure()
ax1=fig.add_subplot(2,2,1)
ax2=fig.add_subplot(2,2,2)
ax3=fig.add_subplot(2,1,2)

x=np.linspace(-2*np.pi,2*np.pi)
#绘制第一幅图
Y1=np.sin(x)
ax1.plot(x,Y1,label=["Sin(X)"],color='r')
ax1.legend(loc="best",ncol=0)
ax1.grid(color='k')
#绘制第二幅图
Y2=np.cos(x)
ax2.plot(x,Y2,color='green',linewidth=5)
ax2.set_title("Cos(X)")
ax2.set_xlabel("X")
ax2.set_ylabel("Y")

#绘制第三幅图
Y3=np.tan(x)
ax3.plot(x,Y3,'ro--',linewidth=8)
ax3.set_xlabel('X')
ax3.set_ylabel('Y')
ax3.set_title("tan(X)")
ax3.set_xlim(-4*np.pi,4*np.pi)
#显示图像
plt.show()
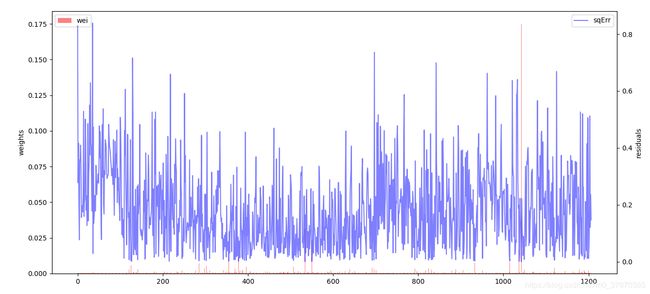
twinx()
fig, ax = plt.subplots(figsize=(15, 7))
print(resifoler +'/'+ file)

resdata = np.loadtxt(resifoler +'/'+ file)  # load data
weidata = np.loadtxt(weifoler +'/'+ file)  # load data

ax.bar(np.arange(len(weidata)), weidata, label="wei", color="red", alpha=0.5)
plt.legend(loc=2)
axx = ax.twinx()
axx.plot(resdata, label="sqErr", color="blue", alpha=0.5)
plt.legend(loc=1)
ax.set_ylabel("weights")
axx.set_ylabel("residuals")
plt.show()
curve_fit
#Header
import numpy as np
import matplotlib.pyplot as plt
from numpy import exp, linspace, random
from scipy.optimize import curve_fit

#Define the Gaussian function
def gaussian(x, amp, cen, wid):
 return amp * exp(-(x-cen)**2 / wid)

#Create the data to be fitted
x = linspace(-10, 10, 101)
y = gaussian(x, 2.33, 0.21, 1.51) + random.normal(0, 0.2, len(x))
np.savetxt ('data.dat',[x,y])  #[x,y] is is saved as a matrix of 2 lines

#Set the initial(init) values of parameters need to optimize(best)
init_vals = [1, 0, 1] # for [amp, cen, wid]

#Define the optimized values of parameters
best_vals, covar = curve_fit(gaussian, x, y, p0=init_vals, maxfev=10000000)
print(best_vals) # output: array [2.27317256  0.20682276  1.64512305]

#Plot the curve with initial parameters and optimized parameters
y1 = gaussian(x, *best_vals) #best_vals, '*'is used to read-out the values in the array
y2 = gaussian(x, *init_vals) #init_vals
plt.plot(x, y, 'bo',label='raw data')
plt.plot(x, y1, 'r-',label='best_vals')
plt.plot(x, y2, 'k--',label='init_vals')
#plt.show()

#Labels
plt.title("Gaussian Function Fitting")
plt.xlabel('x coordinate')
plt.ylabel('y coordinate')
plt.legend()
leg = plt.legend()  # remove the frame of Legend, personal choice
leg.get_frame().set_linewidth(0.0) # remove the frame of Legend, personal choice
#leg.get_frame().set_edgecolor('b') # change the color of Legend frame
#plt.show()


