论文笔记:Selective Search for Object Recognition
abstract
- 论文发布于2012年,主要是用于解决目标坚持任务中候选框该如何选择的问题
- 该算法大大减少了穷举法选择出来的候选框数目,这可以机器学习算法更powerful
introduction
images are intrinsically hierarchical: In Figure 1a the salad and spoons are inside the salad bowl, which in turn stands on the table
将各个区域归成一组有多种原因

比如说上图,我们可以通过颜色区分两只猫,而不能通过纹理区分
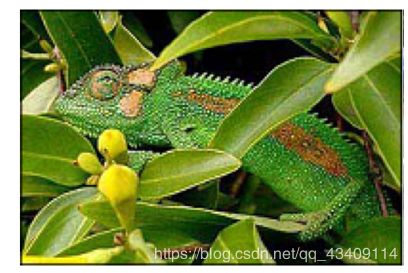
而上图的变色龙,我们可以通过纹理区别,而不能通过颜色区分
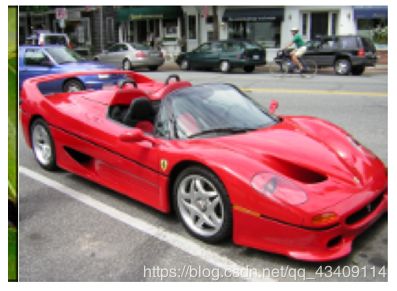
图上中,车的轮子跟车相比,颜色和纹理都不相同,但是他们确是一类
- 穷搜法缺点很明显,就是效率太低。遍历搜索所有可能存在物体的box显然是不现实的,而且搜索框还会受到大小、长宽比等因素的影响
aim to combine the best of the intuitions of seg- mentation and exhaustive search and propose a data-driven selec- tive search
- 本文提出的select search就是为了将区域分割和穷搜法结合起来
aim to combine the best of the intuitions of seg- mentation and exhaustive search and propose a data-driven selec- tive search
- 受到穷搜法启发,算法目标就是捕获所有可能存在物体的区域。但是,在进行采样的时候,不只是使用单一的方法,而是使用多样化的采样技术从而考虑不同条件下的图片
Inspired by exhaustive search, we aim to capture all possible object locations. Therefore, instead of using a single sampling technique, we aim to diversify the sampling techniques to account for as many image conditions as possible >>
- 作者使用多种策略来进行区域分割,比如使用将图像转换到多种颜色空间中、使用多种合并策略。该算法主要应用于目标检测
Specifically, we use a data-driven grouping- based strategy where we increase diversity by using a variety of complementary grouping criteria and a variety of complementary colour spaces with different invariance properties
-
有哪些好的分割和合并策略 ?
-
select search算法的时间复杂度如何?
-
我们能不能将select search算法应用到更power到目标检测分类器中
Exhaustive Search
- 因为搜索的空间太大,所以穷搜法是非常昂贵的
the visual search space is huge, making an exhaustive search computationally expensive
- 目前来说,绝大多数的滑动窗口技术都使用了比较粗糙的搜索网格,并且固定了长宽比
Hence most of these sliding window techniques use a coarse search grid and fixed aspect ratios
Selective Search
为了体现diversification,所以作者提出了多种策略。
- 对图像使用不同的颜色空间
- 使用多种相似度计算方法
其中最重要的是要计算相似度,如下;

在计算颜色相似度的时候,对每个颜色通道使用25个bin的直方图进行统计,如果有k个通道,则最终得出的颜色向量长度即为25xK。计算过程如上
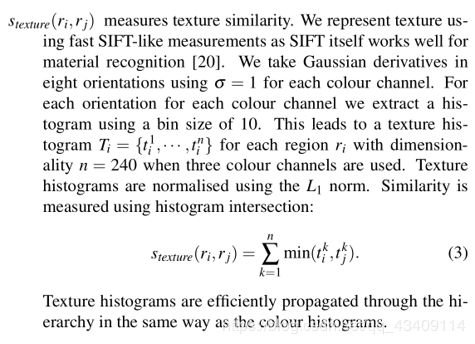
纹理相似度的计算,计算region的梯度直方图,每个颜色通道分10个bin,如果有K的通道,则最终纹理向量长度为10xK
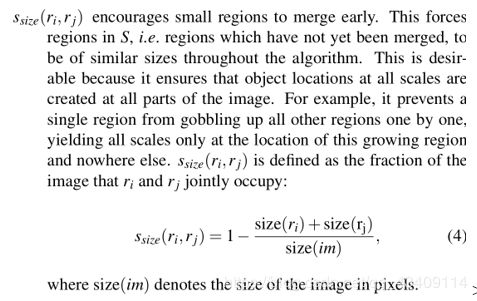
大小相似度的计算,提出这个相似度主要是为了可以让小的区域优先被合并,而较大的区域尽量不被合并
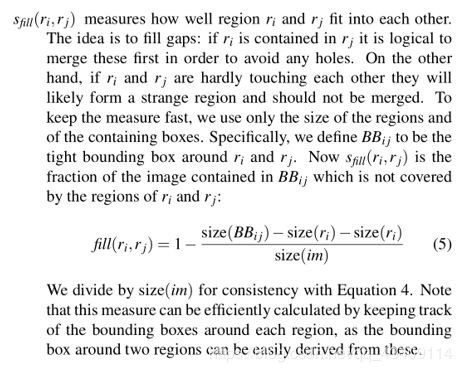
这个是用来计算覆盖相似度的,BB是可以覆盖两个region最小的矩形框的大小
如果两个区域是相互包含的,那么这个相似度最终计算出来的结果是比较大的,如果两个区域相距较远,那么最终计算结果就会比较小

对上文提到的四种相似度计算法进行加权求和
Algorithm
算法步骤如上。
- 首先使用过分割算法将原始图像分割成一个个区域
- 然后提取各个区域的neighbor,并且计算他们之间的相似度
- 进行循环,首先取出相似度最大的两个区域,进行合并,合并之后再找出合并之后区域的neighbors,并且计算他们的相似度并且加入到相似度集合中,并且加入到区域集合中
- 最终如果相似度集合为空,则跳出循环,得到的R集合,即为我们要找的候选框
Evaluation
作者在该部分,主要是要评测了三个方面的内容。
(1) 一、评测了多种strategy下,selective search算法运行的效果
(2) 二、评测了该算法location的质量好坏
(3) 三、评测了将该算法用于目标检测获得的效果
作者为了评估location的好坏,提出了两个指标

ABO的计算也很简单,就是物体c所有覆盖率之和除以物体C真正的面积

Overlap这个指标就是检测两个region相互覆盖的比例,其计算方式很简单,就是region1 并上 region2的面积 除以region1和region2的面积之和
Individual Diversification Stragies
-
这部分主要是评估了单一策略对算法的影响
-
论文为了多样化策略,提供了三种方法,第一种就是改变颜色空间,第二种就是改变相似度计算方式,但三种就是改变过分割算法的参数
(1) In this paper we propose three diversification strategies to obtain good quality object hypotheses: varying the colour space, vary- ing the similarity measures, and varying the thresholds to obtain the starting regions
上图即为实验结果。 图片左部是改变相似度计算方法对MABO的影响,可以看出使用texture相似度效果是最差的。 图片右上部指的是颜色空间对MABO算法的影响,其中HSV效果是最好的,RGB效果也还行。 图片的右下部是过分割算法参数对MABO的影响,可以看到50是最好的
Combinations of Diversification Startegies
这部分主要评估了分割多种策略组合时对算法MABO和算法运行时间的影响
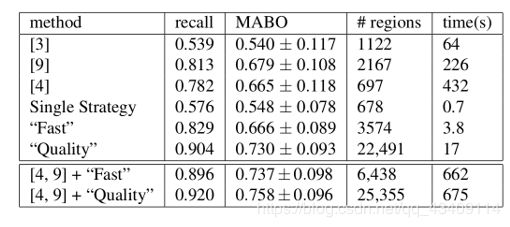
上图为实验结果,可以看出结合的策略越少,窗口数目就越少,运行时间也越少
但是随着结合策略数目的增多,运行时间也越来越长,窗口数目也越来越多了
以下为三种常用的selective-search算法
(i) Single Strategy:HSV颜色空间、四种相似度、k=100 >>
(ii) Fast Startegy:HSV、Lab颜色空间,CTSF、TSF两种相似度计算,k=50、100 >>
(iii) Quality Strategy:HSV、Lab、rgI三种颜色空间;H、I 两种颜色通道;CTSF、TSF、F、S四种计算相似度策略;k=50、100、150、300 >>
Box-based Location
- 上图为selective-search算法产生的box-location与样本标记的location的对比(其中绿色为真实标签),可以看出效果是非常好的
(a) As shown in Table 5, our “Fast” and “Quality” selective search methods yield a close to optimal recall of 98% and 99% respec- tively. In terms of MABO, we achieve 0.804 and 0.879 respec- tively. To appreciate what a Best Overlap of 0.879 means, Figure 5 shows for bike, cow, and person an example location which has an overlap score between 0.874 and 0.884. This illustrates that our selective search yields high quality object locations
-上图显示了窗口数量对recall和MABO的影响,可以看出,SSF综合效果是最好的。
- 上图显示了使用不同算法来检测不同物体时,其ABO的变化。可以看出,综合起来selective search是比较好的

上图是select-search算法(第二列)、算法4(第三列)、算法9(第四列)对图像的影响
第一张图片,除了select search算法,其他算法分割的结果都不太好,这是因为selective search算法有fill相似度的加持
In the first image, the other methods have problems keeping the white label of the bottle and the book apart. In our case, one of our strategies ignores colour while the “fill” similarity (Eq. 5) helps grouping the bottle and label together >>
第二张图片是一个在黑夜中拍摄的小轿车,可以看到,select-search算法分割的效果最好,这是因为有colour的加持,因为lab颜色空间对光线不敏感
The second image is an example of a dark image on which our algo- rithm has generally strong results due to using a variety of colour spaces >>
第三张图片是一个猫在睡瞌睡,select-saerch算法效果没有4和9号
our method sometimes generates segments with an irregular border, which is illustrated by the third image of a cat
第四张图片,因为环境因素,三种算法效果除了9,另外2种都比较好
The final image shows a very difficult example, for which only [4] provides an accurate segment >>
上图可以看到,selective—search 运行速度与其他算法相比是快的多。


