计算两个对应点集之间的旋转矩阵R和转移矩阵T
假设有两个点集A和B,且这两个点集合的元素数目相同且一一对应。为了寻找这两个点集之间的旋转矩阵 R R 和转移矩阵 t t 。可以将这个问题建模成如下的公式:
B=R∗A+t B = R ∗ A + t
为了寻找 R R 和 t t ,通常需要一下三个步骤:
- 计算点集合的中心点
- 将点集合移动到原点,计算最优旋转矩阵 R R
- 计算转移矩阵 t t
计算中心点
P=⎡⎣⎢⎢xyz⎤⎦⎥⎥μA=1N∑i=1NPiAμB=1N∑i=1NPiB P = [ x y z ] μ A = 1 N ∑ i = 1 N P A i μ B = 1 N ∑ i = 1 N P B i
将点集合移动到原点,计算最优旋转矩阵 R R
为了计算旋转矩阵 R R ,需要消除转移矩阵 t t 的影响,所以我们首先需要将点集重新中心化,生成新点集合 A′ A ′ 和 B′ B ′ ,然后计算性的点集之间的协方差矩阵:
点集重新中心化
A′i={PiA−μA}B′i={PiB−μB} A i ′ = { P A i − μ A } B i ′ = { P B i − μ B }
注意其中的, PiA P A i 、 PiB P B i 、 μA μ A 和 μB μ B 不是标量是向量。
计算点集之间的协方差矩阵H
H=∑i=1NA′iB′iT=∑i=1N(PiA−μA)(PiB−μB)T H = ∑ i = 1 N A i ′ B i ′ T = ∑ i = 1 N ( P A i − μ A ) ( P B i − μ B ) T
通过SVD方法获得矩阵的 U U 、 S S 和 V V ,可以计算点集之间的旋转矩阵 R R
[U,S,V]=SVD(H)R=VUT [ U , S , V ] = S V D ( H ) R = V U T
计算转移矩阵 t t
最后,通过 R R 可以获得转移矩阵 t t
t=−R×μA+μB t = − R × μ A + μ B
下面通过python代码编写一个小例子验证一下上面的公式。
下面这个例子,首先通过随机函数生成两个三维点集A,旋转矩阵 R R 和 t t 。通过公式 B=RAT+t B = R A T + t 获得新的点集B。然后通过上述的方法计算点集A和B之间的旋转矩阵 R′ R ′ 和 t′ t ′ ,通过公式 B′=R′AT+t′ B ′ = R ′ A T + t ′ 生成新的点集合B’。并计算两个点集合之间的RMSE。
from numpy import *
from math import sqrt
from mpl_toolkits.mplot3d import Axes3D
import matplotlib.pyplot as plt


def rigid_transform_3D(A, B):
    assert len(A) == len(B)
    N = A.shape[0];
    mu_A = mean(A, axis=0)
    mu_B = mean(B, axis=0)

    AA = A - tile(mu_A, (N, 1))
    BB = B - tile(mu_B, (N, 1))
    H = transpose(AA) * BB

    U, S, Vt = linalg.svd(H)
    R = Vt.T * U.T

    if linalg.det(R) < 0:
        print "Reflection detected"
        Vt[2, :] *= -1
        R = Vt.T * U.T

    t = -R * mu_A.T + mu_B.T

    return R, t

if __name__=='__main__':

    R = mat(random.rand(3,3))
    t = mat(random.rand(3,1))

    U,S,Vt = linalg.svd(R)
    R = U*Vt
    if linalg.det(R) < 0:
        Vt[2,:]*=-1
        R = U*Vt

    n = 10

    A = mat(random.rand(n,3))
    B = R*A.T + tile(t,(1,n))
    B = B.T

    ret_R, ret_t = rigid_transform_3D(A,B)
    A2 = (ret_R*A.T)+ tile(ret_t,(1,n))
    A2 =A2.T

    err = A2-B

    err = multiply(err,err)
    err = sum(err)
    rmse = sqrt(err/n)

    print "points A2"
    print A2
    print ""

    print "points B"
    print B
    print ""
    print rmse
    fig = plt.figure()
    ax=fig.add_subplot(111,projection='3d')
    ax.scatter(A[:,0],A[:,1],A[:,2])
    ax.scatter(B[:,0],B[:,1],B[:,2],s=100,marker='x')
    ax.scatter(A2[:,0],A2[:,1],A2[:,2],s=100,marker= 'o')
    plt.legend()
    plt.show()
通过上述代码生成的点集 B′ B ′ 和 B B 中的所有元素如下所示:
points A2
[[0.65985419 1.60528398 1.38340275]
 [0.92739301 1.68052107 0.90692937]
 [0.3398634  1.20672748 1.24869353]
 [0.76117272 1.46282089 1.35712503]
 [0.45657103 1.17657746 0.9993309 ]
 [0.86068981 1.76370772 0.53447625]
 [0.46723696 0.98764769 1.06947054]
 [0.67152812 1.00675099 0.73363394]
 [0.3102857  1.23971537 0.86977264]
 [0.495524   1.10873545 0.93223688]]

points B
[[0.65985419 1.60528398 1.38340275]
 [0.92739301 1.68052107 0.90692937]
 [0.3398634  1.20672748 1.24869353]
 [0.76117272 1.46282089 1.35712503]
 [0.45657103 1.17657746 0.9993309 ]
 [0.86068981 1.76370772 0.53447625]
 [0.46723696 0.98764769 1.06947054]
 [0.67152812 1.00675099 0.73363394]
 [0.3102857  1.23971537 0.86977264]
 [0.495524   1.10873545 0.93223688]]
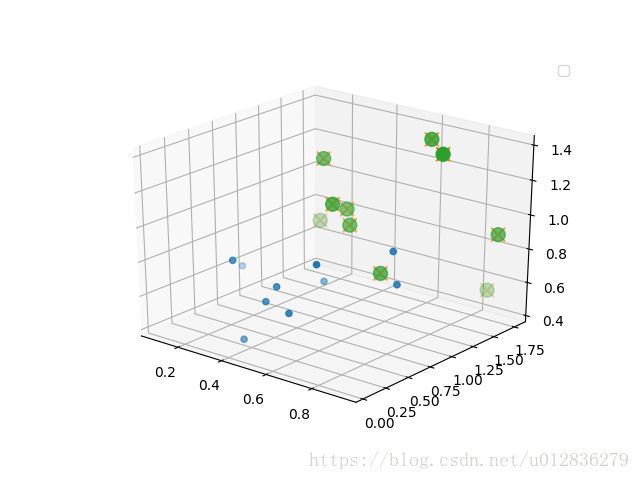
上面小程序的可视化结果如下所示。其中,绿色的圆球和红色的”X”分别表示利用上述方法生成点集 B′ B ′ 和 B B 。蓝色的小圆球表示点集合 A A 。

【引用】
1. Finding optimal rotation and translation between corresponding 3D points