Python——pandas的基本运算及实例代码
Python——pandas的基本运
一、基本介绍
pandas有三种数据结构:一维:series
二维:DataFarme(重点)
三维:MultiIndex
二、Series
一维数组:由索引index和数据data组成
1.创建Series:
import pandas as pd
import random
series=pd.Series(data=range(0,10))
series
结果:
0 0
1 1
2 2
3 3
4 4
5 5
6 6
7 7
8 8
9 9
dtype: int64
2.Series属性
print(series.index)
print(series.values)
结果
RangeIndex(start=0, stop=10, step=1)
[0 1 2 3 4 5 6 7 8 9]
三、DataFrame
DataFrame是一个类似于二维数组或表格(如excel)的对象,既有行索引,又有列索引
1.DataFrame的创建
import numpy as np
data=np.random.randint(0,100,(10,5))
columns=["语文","数学","英语","物理","化学"]
index=['同学' + str(i) for i in range(data.shape[0])]
dataframe=pd.DataFrame(data,columns=columns,index=index)
dataframe
2.DataFrame的属性
print(dataframe.shape)  #显示矩阵形状
print(dataframe.index)  #显示行索引
print(dataframe.columns) #显示列索引
print(dataframe.values)  #显示矩阵值
结果:
(10, 5)
Index([‘同学0’, ‘同学1’, ‘同学2’, ‘同学3’, ‘同学4’, ‘同学5’, ‘同学6’, ‘同学7’, ‘同学8’, ‘同学9’], dtype=‘object’)
Index([‘语文’, ‘数学’, ‘英语’, ‘物理’, ‘化学’], dtype=‘object’)
[[65 38 56 84 53]
[14 53 51 59 55]
[53 68 4 68 0]
[41 21 30 8 8]
[18 94 64 3 96]
[91 94 1 58 4]
[47 25 43 64 31]
[95 18 71 28 27]
[23 61 91 67 76]
[18 84 71 26 25]
3.DataFrame索引的设置
stu = ["学生_" + str(i) for i in range(score_df.shape[0])]

# 必须整体全部修改
data.index = stu
(1) reset_index(drop=False)
设置新的下标索引
drop:默认为False,不删除原来索引,如果为True,删除原来的索引值
(2)set_index(keys, drop=True)
keys : 列索引名成或者列索引名称的列表
drop : boolean, default True.当做新的索引,删除原来的列
四、MultiIndex
MultiIndex是三维的数据结构
五、DataFrame操作
1.索引操作
获取第二个学生的语文成绩:
dataframe.loc [ '同学2','语文',]
获取前三个学生的数学成绩:
dataframe.iloc[:3,1:2]
2.排序
使用df.sort_values(by=, ascending=)
单个键或者多个键进行排序,
参数:
by:指定排序参考的键
ascending:默认升序
ascending=False:降序
ascending=True:升序
data=dataframe.sort_values(by='数学')
data
六、DataFrame运算
1.算术运算:
add sub mul div
dataframe[“数学”].mul(2)
2.逻辑运算:
dataframe[dataframe[“数学”]>30]
query(expr)
expr:查询字符串
通过query使得刚才的过程更加方便简单
dataframe.query("open<24 & open>23").head()
isin(values)
例如判断’数学’是否为83
# 可以指定值进行一个判断,从而进行筛选操作
dataframe[dataframe["数学"].isin([83])]
3.统计运算
dataframe.describe()
dataframe.max(0)  #axis=0为列;axis=1为行
统计函数列表:
sum Sum of values
mean Mean of values
median Arithmetic median of values
min Minimum
max Maximum
mode Mode
abs Absolute Value
prod Product of values
std Bessel-corrected sample standard deviation
var Unbiased variance
idxmax compute the index labels with the maximum
idxmin compute the index labels with the minimum
4.自定义运算
apply(func, axis=0)
七、文件的读取与存储——CSV
1.读取
pandas.read_csv(filepath_or_buffer, sep =',', usecols )
filepath_or_buffer:文件路径
sep :分隔符,默认用","隔开
usecols:指定读取的列名,列表形式
2.写入
DataFrame.to_csv(path_or_buf=None, sep=', ’, columns=None, header=True, index=True, mode='w', encoding=None)
path_or_buf :文件路径
sep :分隔符,默认用","隔开
columns :选择需要的列索引
header :boolean or list of string, default True,是否写进列索引值
index:是否写进行索引
mode:‘w’:重写, ‘a’ 追加
例如:

八、实例
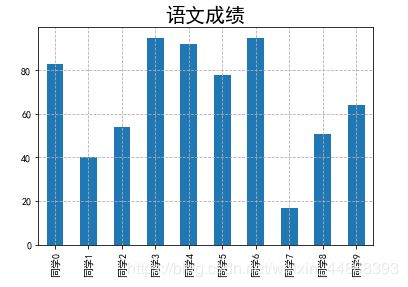
画出10个同学的语文成绩柱状图
import matplotlib.pyplot as plt
from pylab import mpl   #设置字体
mpl.rcParams["font.sans-serif"] = ["SimHei"]
mpl.rcParams["axes.unicode_minus"]=False
data_yuwen=dataframe["语文"]   #取出语文成绩
data_yuwen.plot(kind="bar")       #画图
plt.grid(True,linestyle="--",alpha=1)
plt.title("语文成绩",fontsize=20)
plt.show()          #显示图像
import matplotlib.pyplot as plt
import numpy as np
import pandas as pd
from pylab import mpl   #设置字体
mpl.rcParams["font.sans-serif"] = ["SimHei"]
mpl.rcParams["axes.unicode_minus"]=False

data=np.random.randint(0,100,(10,5))
columns=["语文","数学","英语","物理","化学"]
index=['同学' + str(i) for i in range(data.shape[0])]
dataframe=pd.DataFrame(data,columns=columns,index=index)
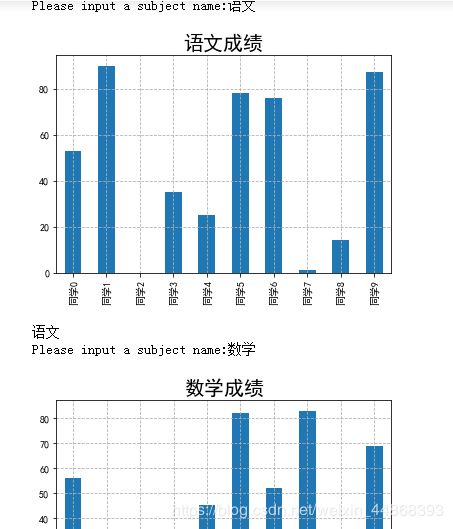
while True:
    a=input("Please input a subject name:")
    if a=='语文':
        data_yuwen=dataframe["语文"]   #取出语文成绩
        data_yuwen.plot(kind="bar")       #画图
        plt.grid(True,linestyle="--",alpha=1)
        plt.title("语文成绩",fontsize=20)
        plt.show()          #显示图像
        print(a)
    elif a=='数学':
        data_shuxue=dataframe["数学"]   #取出数学成绩
        data_shuxue.plot(kind="bar")
        plt.grid(True,linestyle="--",alpha=1)
        plt.title("数学成绩",fontsize=20)
        plt.show()          #显示图像
    elif a=='英语':
        data_yingyu=dataframe["英语"]   #取出英语成绩
        data_yingyu.plot(kind="bar")
        plt.grid(True,linestyle="--",alpha=1)
        plt.title("英语成绩",fontsize=20)
        plt.show()          #显示图像
    elif a=='物理':
        data_wuli=dataframe["物理"]   #取出物理成绩
        data_wuli.plot(kind="bar")
        plt.grid(True,linestyle="--",alpha=1)
        plt.title("物理成绩",fontsize=20)
        plt.show()          #显示图像
    elif a=='化学':
        data_huaxue=dataframe["化学"]   #取出化学成绩
        data_huaxue.plot(kind="bar")
        plt.grid(True,linestyle="--",alpha=1)
        plt.title("化学成绩",fontsize=20)
        plt.show()          #显示图像
    else:
        print("error")
        break


