Matplotlib 简单绘直方图、饼图、极坐标图、气泡图
1 直方图:效果图和代码如下:
import numpy as np
import matplotlib.mlab as mlab
import matplotlib.pyplot as plt

# example data
mu = 100
sigma = 15
x = mu + sigma*np.random.randn(1000)

#直方图的条数
num_bins = 50
n, bins, patches = plt.hist(x, num_bins, normed=1, facecolor = "b", alpha=0.5)
#添加一个拟合曲线,返回概率密度函数
y = mlab.normpdf(bins, mu, sigma)
plt.plot(bins,y,"r--")
#fontproperties显示中文simHei Lishu STSong Kaiti FangSong YouYuan
plt.xlabel("横轴",fontproperties = "simHei",fontsize = 14)
plt.ylabel("纵轴",fontproperties = "simHei",fontsize = 14)
plt.title("simple histogram")
#text(x,y,str)指定图像位置输入文字;latex语法$$添加公式
plt.text(100,0.033,"$\mu=100$,$\sigma=15$")
#调整图像的间距,防止y轴数值与label重合
plt.subplots_adjust(left=0.15)
plt.show()
主要代码 hist函数:
n, bins, patches = plt.hist(arr,bins=10,normed=0,facecolor="black",edgecolor="black",alpha=1,histtype="bar")
参数:arr 直方图的一维数组,bins:直方图的柱数,默认为10;normed 归一化,默认为0,facecolor直方图颜色;edgecolor边框颜色 alpha:透明度;histtype:类型“bar”“barstacked”“step”“stepfilled”
返回值:n直方图向量,bins各个bin区间范围,patches:list类型,每个bin里包含的数据
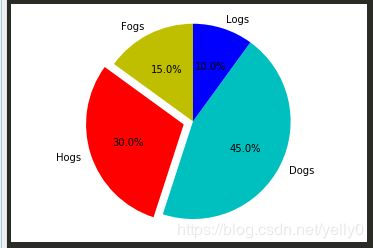
2 饼图
import matplotlib.pyplot as plt

labels = "Fogs","Hogs","Dogs","Logs"
sizes = [15,30,45,10]
colors = ["y","r","c","b"]
explode = (0,0.1,0,0)#分离 突出显示第二块
#绘图 设置数据,突出,颜色,标签,数据显示格式,阴影等
plt.pie(sizes,explode=explode,labels=labels,colors=colors,autopct="%1.1f%%",
        shadow=False,startangle=90)
plt.axis("equal")#正圆效果,轴长度相同
plt.show()
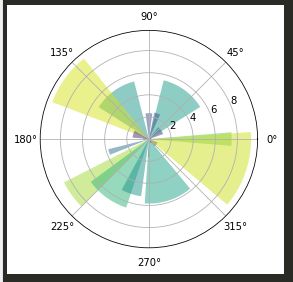
3 极坐标图:这个实际中不常用,效果很好看所以学学。
#面向对象绘制极坐标图:
import numpy as np
import matplotlib.pyplot as plt

N = 20 #数据个数
theta = np.linspace(0.0,2*np.pi,N,endpoint=False)#0-360度,按个数等分
radii = 10*np.random.rand(N)
width = np.pi/4*np.random.rand(N)

ax = plt.subplot(111,projection="polar")#一个绘图区域,绘制极坐标
#绘制起始位置,中心点向边缘绘制的长度,每个绘图区域面积
bars = ax.bar(theta,radii,width,bottom=0.0)
#修改每个绘图区的颜色
for r,bar in zip(radii,bars):
    bar.set_facecolor(plt.cm.viridis(r/10.))
    bar.set_alpha(0.5)

plt.show()
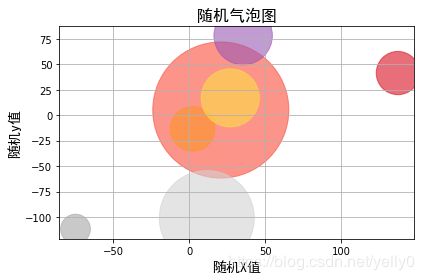
4 气泡图:
气泡图是散点图的一种变体,通过每个点的面积大小,反映第三维数据。
import numpy as np
import matplotlib.pyplot as plt

a = 100*np.random.randn(33).reshape(3,11)

fig, ax = plt.subplots()
colors = ["#99cc01","#ffff01","#0000fe","#a6a6a6","#d91021","#fff161","#0d8ecf"
          ,"#fa4d3d","#d2d2d2","#ffde45","#9b59b6"]
#分别设置X轴值,Y轴值,以及第三个参数值大小来显示气泡大小
ax.scatter(a[0,:],a[1,:],s=100*a[2,:],color=colors,alpha=0.6)
#ax.plot(10*np.random.randn(100),10*np.random.randn(100),"o")
ax.set_title("随机气泡图",fontproperties = "simHei",fontsize = 16)
ax.set_xlabel("随机X值",fontproperties = "simHei",fontsize = 14)
ax.set_ylabel("随机y值",fontproperties = "simHei",fontsize = 14)
ax.grid(True)
fig.tight_layout()
plt.show()
python路漫漫,学习无止尽。


