python数据分析处理:PUBG Finish Placement Prediction
PUBG Finish Placement Prediction (Kernels Only)
比赛网址:https://www.kaggle.com/c/pubg-finish-placement-prediction/data
问题背景:
在PUBG游戏中,每场比赛最多有100名玩家,玩家可以根据在自己被淘汰时还有多少玩家活着从而获得比赛排名。 在游戏中,玩家可以拿起不同的武器攻击敌人,也可以恢复被击倒但未被杀死的队友,驾驶车辆,游泳,跑步,射击,并承担相应的结果-例如跑太远或被敌人杀死。为了赢得比赛,你需要获取武器和可用设备以消灭其他人并生存到最后。因此,如果你想看到’大吉大利,今晚吃鸡!’ ,根据实际情况制定一些合理的策略是非常有益的。例如,一个合适的跳伞位置可以帮助你更快地收集装备,你从不断缩小的蓝色圆圈区域中逃脱的路径(蓝色区域外玩家将不断受到伤害直到死亡)可以帮助你避免一些危险的敌人并找到一个合适的位置隐藏在最后一个圈子有助于获得’大吉大利,今晚吃鸡’。
你将获得大量匿名的PUBG游戏统计数据,其格式设置为每行包含一个玩家的游戏后统计数据。你将创建一个模型,根据他们的最终统计数据预测他们的相应排名。
3.目的:
鉴于先前玩家在每场比赛期间的统计数据和训练数据中的排名信息,我们需要训练模型根据每场比赛期间的统计数据预测测试组中球员的排名。目标标签排名将是0到1之间的百分比值,更高的百分比表示该匹配中的更高排名。在这个过程中,我们将分析诸多因素对获胜的影响。
4.数据字段(变量含义):
DBNOs : 玩家击倒的敌人数量
assists : 玩家造成伤害且被队友所杀死的敌人数量
boosts : 玩家使用的增益性物品数量
damageDealt : 玩家造成的总伤害-玩家所受的伤害
headshotKills : 玩家通过爆头杀死的敌人数量
heals : 玩家使用的救援类物品数量
Id : 玩家的ID
killPlace : 玩家杀死敌人数量的排名
killPoints : 基于杀戮的玩家外部排名。
killStreaks : 玩家在短时间内杀死敌人的最大数量
kills : 玩家杀死的敌人的数量
longestKill : 玩家和玩家在死亡时被杀的最长距离。
matchDuration : 比赛时间
matchId : 比赛的ID
matchType :  单排/双排/四排;标准模式是“solo”,“duo”,“squad”,“solo-fpp”,“duo-fpp”和“squad-fpp”; 其他模式来自事件或自定义匹配。
rankPoints : 类似Elo的玩家排名。
revives : 玩家救援队友的次数
rideDistance : 玩家使用交通工具行驶了多少米
roadKills : 玩家在交通工具上杀死敌人的数目
swimDistance : 玩家游泳的距离
teamKills : 该玩家杀死队友的次数
vehicleDestroys : 玩家毁坏的交通工具数目
walkDistance : 玩家步行距离
weaponsAcquired : 玩家捡枪数量
winPoints : 基于赢的玩家外部排名。
groupId : 队伍的ID
numGroups : 在该局比赛中有玩家数据的队伍数量
maxPlace : 在该局中已有数据的最差的队伍名次
winPlacePerc : 预测目标,是以百分数计算的,介于0-1之间,1对应第一名,0对应最后一名。 它是根据maxPlace计算的,而不是numGroups,因此匹配中可能缺少某些队伍。
实现思路
我们主要采用线性回归的方式进行数据分析与探索,并取得了较好的效果。我们将在线性回归基础上,采用神经网络、GBR、Light GBM的方式提升性能,最终取得了较好的效果。
我们采用单独分析与综合分析相结合的方式,对诸多因素进行筛选,选出最重要的影响因素,并分析其对最终排名的影响,当然我们首先进行了单变量、双变量的数据探索性分析,得到诸多结论,并结合这些结论进行多变量数据探索分析,得到了我们最终的模型。
我们调用了常用的python数据处理相关的库进行使用
1.基础工作
import:调用加载相关的库
import numpy as np
import pandas as pd
import seaborn as sns
import matplotlib.pyplot as plt
读取数据集:(将数据保存在train变量中)
train = pd.read_csv('train_V2.csv')
查看数据中包含的变量以及相应的变量类型(用以方便之后的操作)
train.info()
运行结果如下:
<class 'pandas.core.frame.DataFrame'>
RangeIndex: 4446966 entries, 0 to 4446965
Data columns (total 29 columns):
Id                 object
groupId            object
matchId            object
assists            int64
boosts             int64
damageDealt        float64
DBNOs              int64
headshotKills      int64
heals              int64
killPlace          int64
killPoints         int64
kills              int64
killStreaks        int64
longestKill        float64
matchDuration      int64
matchType          object
maxPlace           int64
numGroups          int64
rankPoints         int64
revives            int64
rideDistance       float64
roadKills          int64
swimDistance       float64
teamKills          int64
vehicleDestroys    int64
walkDistance       float64
weaponsAcquired    int64
winPoints          int64
winPlacePerc       float64
dtypes: float64(6), int64(19), object(4)
memory usage: 983.9+ MB
我们可以得到数据中的变量以及相关的变量内容,便于之后的分析与操作。值得一提的是,这里的数据集980+MB,是一个非常大量的数据集。
我们查看前15组数据:
train.head(15)
结果如下:
| Id | groupId | matchId | assists | boosts | damageDealt | DBNOs | headshotKills | heals | killPlace | killPoints | kills | killStreaks | longestKill | matchDuration | matchType | maxPlace | numGroups | rankPoints | revives | rideDistance | roadKills | swimDistance | teamKills | vehicleDestroys | walkDistance | weaponsAcquired | winPoints | winPlacePerc | |
|---|---|---|---|---|---|---|---|---|---|---|---|---|---|---|---|---|---|---|---|---|---|---|---|---|---|---|---|---|---|
| 0 | 7f96b2f878858a | 4d4b580de459be | a10357fd1a4a91 | 0 | 0 | 0.000000 | 0 | 0 | 0 | 60 | 1241 | 0 | 0 | 0.00000 | 1306 | squad-fpp | 28 | 26 | -1 | 0 | 0.000000 | 0 | 0.000000 | 0 | 0 | 244.7500 | 1 | 1466 | 0.444336 |
| 1 | eef90569b9d03c | 684d5656442f9e | aeb375fc57110c | 0 | 0 | 91.500000 | 0 | 0 | 0 | 57 | 0 | 0 | 0 | 0.00000 | 1777 | squad-fpp | 26 | 25 | 1484 | 0 | 0.004501 | 0 | 11.039062 | 0 | 0 | 1434.0000 | 5 | 0 | 0.640137 |
| 2 | 1eaf90ac73de72 | 6a4a42c3245a74 | 110163d8bb94ae | 1 | 0 | 68.000000 | 0 | 0 | 0 | 47 | 0 | 0 | 0 | 0.00000 | 1318 | duo | 50 | 47 | 1491 | 0 | 0.000000 | 0 | 0.000000 | 0 | 0 | 161.7500 | 2 | 0 | 0.775391 |
| 3 | 4616d365dd2853 | a930a9c79cd721 | f1f1f4ef412d7e | 0 | 0 | 32.906250 | 0 | 0 | 0 | 75 | 0 | 0 | 0 | 0.00000 | 1436 | squad-fpp | 31 | 30 | 1408 | 0 | 0.000000 | 0 | 0.000000 | 0 | 0 | 202.7500 | 3 | 0 | 0.166748 |
| 4 | 315c96c26c9aac | de04010b3458dd | 6dc8ff871e21e6 | 0 | 0 | 100.000000 | 0 | 0 | 0 | 45 | 0 | 1 | 1 | 58.53125 | 1424 | solo-fpp | 97 | 95 | 1560 | 0 | 0.000000 | 0 | 0.000000 | 0 | 0 | 49.7500 | 2 | 0 | 0.187500 |
| 5 | ff79c12f326506 | 289a6836a88d27 | bac52627a12114 | 0 | 0 | 100.000000 | 1 | 1 | 0 | 44 | 0 | 1 | 1 | 18.43750 | 1395 | squad-fpp | 28 | 28 | 1418 | 0 | 0.000000 | 0 | 0.000000 | 0 | 0 | 34.6875 | 1 | 0 | 0.036987 |
| 6 | 95959be0e21ca3 | 2c485a1ad3d0f1 | a8274e903927a2 | 0 | 0 | 0.000000 | 0 | 0 | 0 | 96 | 1262 | 0 | 0 | 0.00000 | 1316 | squad-fpp | 28 | 28 | -1 | 0 | 0.000000 | 0 | 0.000000 | 0 | 0 | 13.5000 | 1 | 1497 | 0.000000 |
| 7 | 311b84c6ff4390 | eaba5fcb7fc1ae | 292611730ca862 | 0 | 0 | 8.539062 | 0 | 0 | 0 | 48 | 1000 | 0 | 0 | 0.00000 | 1967 | solo-fpp | 96 | 92 | -1 | 0 | 2004.000000 | 0 | 0.000000 | 0 | 0 | 1089.0000 | 6 | 1500 | 0.736816 |
| 8 | 1a68204ccf9891 | 47cfbb04e1b1a2 | df014fbee741c6 | 0 | 0 | 51.593750 | 0 | 0 | 0 | 64 | 0 | 0 | 0 | 0.00000 | 1375 | squad | 28 | 27 | 1493 | 0 | 0.000000 | 0 | 0.000000 | 0 | 0 | 800.0000 | 4 | 0 | 0.370361 |
| 9 | e5bb5a43587253 | 759bb6f7514fd2 | 3d3031c795305b | 0 | 0 | 37.281250 | 0 | 0 | 0 | 74 | 0 | 0 | 0 | 0.00000 | 1930 | squad | 29 | 27 | 1349 | 0 | 0.000000 | 0 | 0.000000 | 0 | 0 | 65.6875 | 1 | 0 | 0.214355 |
| 10 | 2b574d43972813 | c549efede67ad3 | 2dd6ddb8320fc1 | 0 | 0 | 28.380 | 0 | 0 | 0 | 75 | 0 | 0 | 0 | 0.00 | 1811 | squad-fpp | 29 | 29 | 1475 | 0 | 0.0000 | 0 | 0.00 | 0 | 0 | 868.30 | 9 | 0 | 0.3929 |
| 11 | 8de328a74658a9 | f643df9df3877c | 80170383d90003 | 0 | 0 | 137.900 | 1 | 0 | 0 | 64 | 0 | 0 | 0 | 0.00 | 1384 | duo-fpp | 48 | 46 | 1488 | 0 | 0.0000 | 0 | 0.00 | 0 | 0 | 451.70 | 1 | 0 | 0.4043 |
| 12 | ce4f6ac165705e | da24cdb91969cc | 535b5dbd965a94 | 0 | 0 | 0.000 | 0 | 0 | 0 | 37 | 0 | 0 | 0 | 0.00 | 1774 | squad-fpp | 29 | 28 | 1766 | 0 | 6639.0000 | 0 | 0.00 | 0 | 0 | 2784.00 | 6 | 0 | 0.9286 |
| 13 | b7807186e3f679 | 3c08e461874749 | 2c30ddf481c52d | 0 | 1 | 324.200 | 0 | 1 | 5 | 5 | 986 | 4 | 1 | 49.83 | 1886 | solo-fpp | 97 | 94 | -1 | 0 | 1228.0000 | 0 | 76.84 | 0 | 0 | 2050.00 | 6 | 1462 | 0.8750 |
| 14 | 8e244ac61b6aab | d40d0c7d3573a1 | 94e1c1cc443c65 | 0 | 1 | 122.800 | 1 | 0 | 2 | 25 | 1411 | 1 | 1 | 37.91 | 1458 | squad-fpp | 31 | 30 | -1 | 1 | 1237.0000 | 0 | 60.29 | 0 |
至此,我们完成了数据的读取,大致了解了数据集的内容以及相关的细节。基于此,我们将开始对数据进行处理与分析,并完成所求,我们将循序渐进地对数据进行探索。
我们在此处运用了CSDN上关于大数据处理的一些方法,有效的降低了数据所占的内存空间。主要思路为将部分所占空间大的数据类型在不失去数据的情况下将其改为所占空间较小的数据类型,我们将依次遍历,最终将内存降低了一半以上。例如: 对于kills,发现它的绝对值不超过50,所以可以将原本int64的数据类型转为int8,这样对于1MB的数据能压缩至0.125MB。基于该思路我们实现了数据占用空间的有效压缩。
def reduce_mem_usage(df):
    start_mem = df.memory_usage().sum() / 1024**2
    print('Memory usage of dataframe is {:.2f} MB'.format(start_mem))
    for col in df.columns:
        col_type = df[col].dtype
        if col_type != object:
            c_min = df[col].min()
            c_max = df[col].max()
            if str(col_type)[:3] == 'int':
                if c_min > np.iinfo(np.int8).min and c_max < np.iinfo(np.int8).max:
                    df[col] = df[col].astype(np.int8)
                elif c_min > np.iinfo(np.int16).min and c_max < np.iinfo(np.int16).max:
                    df[col] = df[col].astype(np.int16)
                elif c_min > np.iinfo(np.int32).min and c_max < np.iinfo(np.int32).max:
                    df[col] = df[col].astype(np.int32)
                elif c_min > np.iinfo(np.int64).min and c_max < np.iinfo(np.int64).max:
                    df[col] = df[col].astype(np.int64)
            else:
                if c_min > np.finfo(np.float16).min and c_max < np.finfo(np.float16).max:
                    df[col] = df[col].astype(np.float16)
                elif c_min > np.finfo(np.float32).min and c_max < np.finfo(np.float32).max:
                    df[col] = df[col].astype(np.float32)
                else:
                    df[col] = df[col].astype(np.float64)
    end_mem = df.memory_usage().sum() / 1024**2
    print('Memory usage after optimization is: {:.2f} MB'.format(end_mem))
    print('Decreased by {:.1f}%'.format(100 * (start_mem - end_mem) / start_mem))
    return df
运行结果:
Memory usage of dataframe is 983.90 MB
Memory usage after optimization is: 288.39 MB
Decreased by 70.7%
2.基础数据探索
在单变量数据探索中,我们基于自己的游戏体验,较为感兴趣且认为较为重要的变量为玩家在每一局的杀敌数、造成的伤害值、步行距离、玩家捡枪数量、玩家使用的救援类物品数量。我们将对数据集中的这些变量进行探索式研究,了解变量的分布以及特点。我们认为这些因素对于一场比赛是否能够取得更高的名次有着较大影响,当然我们最终会通过相关性来验证我们的猜想。
杀敌数
我们将通过对数据集中杀敌数进行统计并以树状图形式形象地显示:
在这里由于杀敌数总体分布取值是分散的,但是我们通过经验可知杀敌数普遍是较少的,故我们采用分位数的数学办法对数据进行一次提取,我们选取的分位数为0.99,从而保证几乎所有的杀敌数都被包括在其中。
#average_killers表示平均杀敌数
average_killers=train['kills'].mean()
#most_killer_max表示杀敌数的0.99分位数,也就是意味着99%的数据小于该数字
most_killer_max=train['kills'].quantile(0.99)
#max_killers表示数据中最大的杀敌数 (该数据是由于我们的兴趣想得知的)
max_killers=train['kills'].max()
#将其输出
print("The average person kills {:.4f} players, 99% of people have {} kills or less, while the most kills ever recorded is {}.".format(average_killers,most_killer_max, max_killers))
结果如下:
The average person kills 0.9248 players, 99% of people have 7.0 kills or less, while the most kills ever recorded is 72.
也就是0.99分位数在7,故我们将在作图时忽略杀敌数大于7的部分,因为其为极少数且不具代表性,如果将所有杀敌数都关注去作图的话会导致图象偏移严重,是很不必要的。
我们用柱状图的方式查看杀敌数分布:
data = train.copy()  #data为train的copy,避免修改了train的值
#将大于7的杀敌数同一归结到larger中
data.loc[data['kills'] > data['kills'].quantile(0.99)] = 'larger'
#作图,以kills为横坐标,数据数量为纵坐标
plt.figure(figsize=(15,10))
sns.countplot(data['kills'].astype('str').sort_values())
plt.title("Kill Count",fontsize=15)
plt.show()
运行结果:
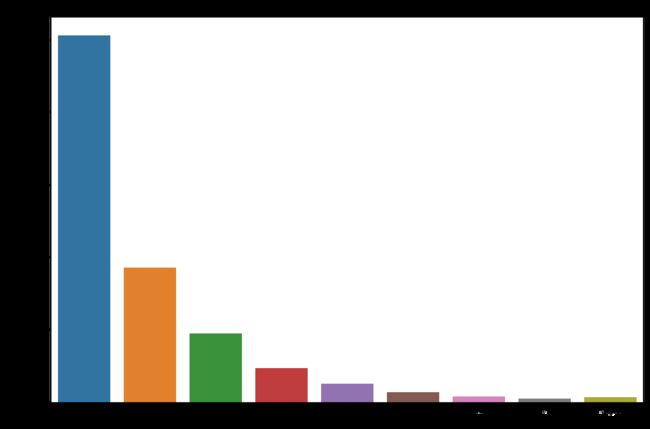
显然,我们通过该图象可知,大多数人杀敌数是为0的,部分杀敌数为1和2,极少数能够杀死更多的敌人。这也是和我们自己的游戏经验所符合的。
由于大多数人没有杀敌数,因此,我们认为对伤害量分析是很有必要的。
伤害量
damageDealt 在这里定义为 玩家造成的总伤害 - 玩家所受的伤害 。damageDealt为一个连续量,取值较为分散,故在此处我们将使用直方图的方式来形象地表示该数据。
代码:
data = train.copy()  #data为train的copy,避免修改了train的值
plt.figure(figsize=(15,10))
plt.title("Damage Dealt ",fontsize=15)
sns.distplot(data['damageDealt'])
plt.show()
data = train.copy()
data = data[data['kills']==0]
plt.figure(figsize=(15,10))
plt.title("Damage Dealt by 0 killers",fontsize=15)
sns.distplot(data['damageDealt'])
plt.show()
运行结果:

我们本计划分别计算最终吃鸡的人平均伤害量以分析,以表示伤害量高的人吃鸡概率最大,但这里数值过于庞大,难以在可接受时间内计算出,故我们转换思路,我们查看伤害量小于0的人以及杀敌为0的人能够吃鸡的概率,反向推理出伤害量和杀敌数与吃鸡的密切相关性。
#no_kill_success_nums表示没有击杀人但是成功吃鸡的人数
no_kill_success_nums=len(data[data['winPlacePerc']==1])
#no_kill_success_rate表示没有击杀人但是成功吃鸡的概率
no_kill_success_rate=no_kill_success_nums/len(train)
#输出
print("{} players ({:.4f}%) have won without a single kill!".format(no_kill_success_nums,100*no_kill_success_rate))
#
data = train[train['damageDealt'] == 0].copy()
#no_damage_success_nums表示伤害为0但成功吃鸡的人数
no_damage_success_nums=len(data1[data1['winPlacePerc']==1]
#no_damage_success_rate表示伤害为0但成功吃鸡的概率
no_damage_success_rate=no_damage_success_nums/len(train)
#输出
print("{} players ({:.4f}%) have won without dealing damage!".format(no_damage_success_nums, 100*no_damage_success_rate))
结果如下:
127573 players (2.8688%) have won without a single kill!
4770 players (0.1073%) have won without dealing damage!
因此很显然看出,杀敌数与伤害值与能否顺利吃鸡密切相关。在之后我们将较为详细地研究该关系。
步行距离
步行距离是指玩家行走距离,pubg游戏一随着游戏的进行会逐渐缩小安全区域,逼迫存活的玩家不断地移动,通常来说,一局中排名越高的玩家,步行距离往往越大,行走距离较多的玩家偏向于更大概率完成吃鸡,我们将用数据说明这一点。我们将对数据中的步行
距离描绘直方图,首先我们对数据预处理,找到0.99分位点,从而避免部分极小小概率事件使得图像偏移严重
print ("平均步行距离为:{:.0f}".format(train['walkDistance'].mean()))
print ("99%的步行距离小于该值:",train['walkDistance'].quantile(0.99))
print ("数据集中最大的步行距离:",train['walkDistance'].max())
结果:
平均步行距离为:1154
99%的步行距离小于该值:4396
数据集中最大的步行距离:25780.0
根据该结果,我们绘制直方图:
data = train[train['walkDistance'] < train['walkDistance'].quantile(0.99)]
plt.figure(figsize=(15,10))
plt.title("The Running Distances")
sns.distplot(data['walkDistance'])   #distplot直方图
plt.show()
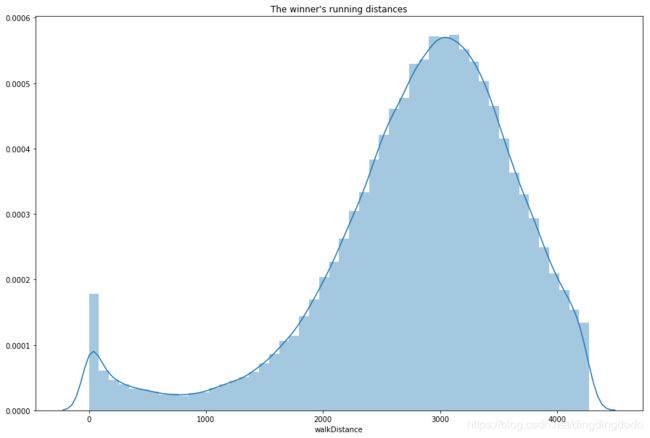
在此处我们查看最后的胜利者的步行距离:
winner_data=train[train['winPlacePerc'] == 1].copy()
winner_data = winner_data[winner_data['walkDistance'] < winner_data['walkDistance'].quantile(0.99)]
plt.figure(figsize=(15,10))
plt.title("The winner's running distances")
sns.distplot(winner_data['walkDistance'])   #distplot直方图
plt.show()
很显然,我们可知最终赢家通常步行距离在3000m左右,也就是较高的步行距离。
玩家捡枪数量
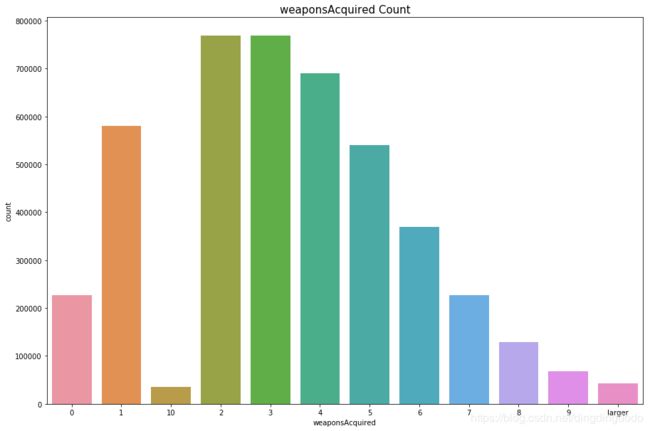
由于拥有更多的弹药补给、武器补给将有着非常大的优势,另外,击杀敌人后玩家很有可能搜刮到新的武器,因此捡枪数量也十分重要故我们将对玩家捡枪数量进行简单探索,并在之后对其影响吃鸡的程度进行深入研究
代码:
print ("平均捡枪数量为:{:.0f}".format(train['weaponsAcquired'].mean()))
print ("捡枪数量的0.99分位数 :",train['weaponsAcquired'].quantile(0.99))
print ("数据集中最大的捡枪数量:",train['weaponsAcquired'].max())
结果:
平均捡枪数量为:4
捡枪数量的0.99分位数 : 10.0
数据集中最大的捡枪数量: 236
故,我们根据结果作图,形象地展示出具体的情况:
data = train.copy()  #data为train的copy,避免修改了train的值
#将大于7的杀敌数同一归结到larger中
data.loc[data['weaponsAcquired'] > data['weaponsAcquired'].quantile(0.99)] = 'larger'
#作图,以kills为横坐标,数据数量为纵坐标
plt.figure(figsize=(15,10))
sns.countplot(data['weaponsAcquired'].astype('str').sort_values())
plt.title("weaponsAcquired Count",fontsize=15)
plt.show()
增益性和治疗性物品
增益性和治疗性物品在游戏中是非常重要的补给,故我们将对其进行初步的数据探索。
我们将先查看一些基础的数据:
average_heals=train['heals'].mean()
quantile_099_heals=train['heals'].quantile(0.99)
print("平均每人使用治疗性物资数量为: {:.1f}, 99%的人使用治疗性物资数量少于:.{}".format(average_heals, quantile_099_heals))
average_boosts=train['boosts'].mean()
quantile_099_boosts=train['boosts'].quantile(0.99)
print("平均每人使用增益性物资数量为: {:.1f}, 99%的人使用增益性物资数量少于:.{}".format(average_boosts, quantile_099_boosts))
结果如下:
平均每人使用治疗性物资数量为: 1.4, 99%的人使用治疗性物资数量少于:.12.0
平均每人使用增益性物资数量为: 1.1, 99%的人使用增益性物资数量少于:.7.0
3.变量关系探索
这一阶段,我们将详细分析各种因素对最终能否吃鸡以及具体排名的影响。我们将采用上一阶段探索的单变量数据在此处进行深入研究,这将让我们对最终获胜的因素有着更明确的了解。
杀敌数
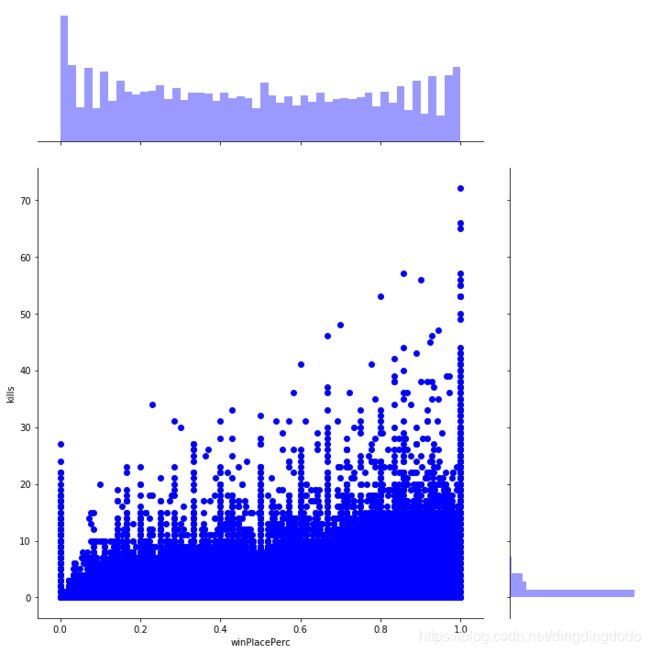
sns.jointplot(x="winPlacePerc", y="kills", data=train, height=10, ratio=3, color="blue")
plt.show()
为了更形象说明,我们也采用了箱线图的方式:
train['kills_rank'] = pd.cut(train['kills'], [-1, 0, 2, 5, 10, 20, 60] ,labels = ['0_kills', '1-2_kills', '3-5_kills', '6-10_kills', '11-20_kills', '20+kills'])
plt.figure(figsize = (10, 6))
sns.boxplot(x = 'kills_rank', y = 'winPlacePerc', data = train)
plt.show()
很显然,排名较高的玩家通常击杀数是比较高的,且最终吃鸡的玩家杀敌数普遍在5个以上。
步行距离
sns.jointplot(x="winPlacePerc", y="walkDistance",  data=train, height=10, ratio=3, color="red")
plt.show()
显然,步行距离与排名有较高的相关性。
增益性和治疗性物品
我们将深入分析增益性和治疗性物品与排名的关系:
我们对二者一起作图:
data = train.copy()
data = data[data['heals'] < data['heals'].quantile(0.99)]
data = data[data['boosts'] < data['boosts'].quantile(0.99)]

f,ax1 = plt.subplots(figsize =(20,10))
sns.pointplot(x='heals',y='winPlacePerc',data=data,color='lime',alpha=0.8)
sns.pointplot(x='boosts',y='winPlacePerc',data=data,color='blue',alpha=0.8)
plt.text(4,0.6,'Heals',color='lime',fontsize = 17,style = 'italic')
plt.text(4,0.55,'Boosts',color='blue',fontsize = 17,style = 'italic')
plt.xlabel('Number of heal/boost items',fontsize = 15,color='blue')
plt.ylabel('Win Percentage',fontsize = 15,color='blue')
plt.title('Heals vs Boosts',fontsize = 20,color='blue')
plt.grid()
plt.show()
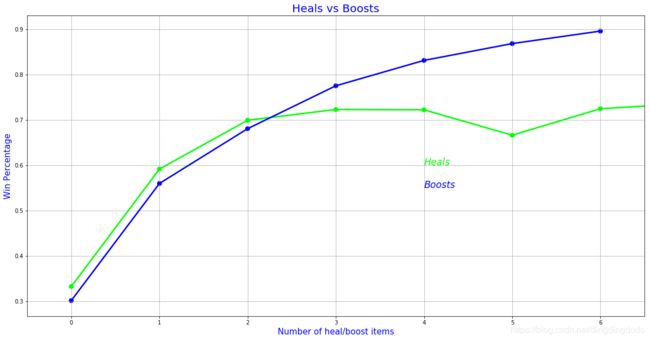
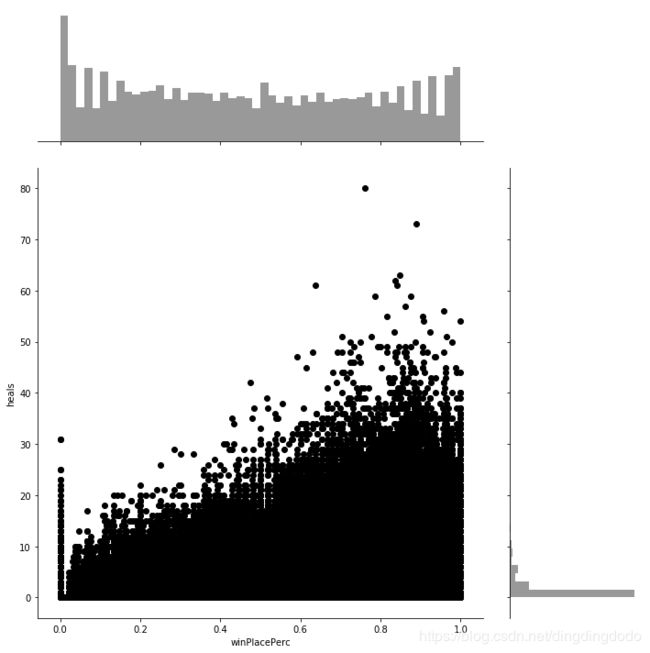
我们分析出增益性和治疗性物品与吃鸡概率是正相关的,也就是能够最终吃鸡的玩家通常都有着较多的增益性和治疗性物品使用。我们将通过散点图描绘该关系,并进一步分析:
sns.jointplot(x="winPlacePerc", y="heals", data=train, height=10, ratio=3, color="black")
plt.show()
sns.jointplot(x="winPlacePerc", y="boosts", data=train, height=10, ratio=3, color="yellow")
plt.show()

我们能够看出排名较高的玩家,通常在游戏中有着较多治疗性物品。对于增益性物品,则更为明显。故我们可以下普遍性结论:获得更多的治疗性和增益性物品的玩家可以取得更好的名次,当然存在部分值异常。
组局方式/匹配方式
该游戏有三种匹配方式,即单排/双排/四排(solo,duos,squads),由于游戏是100个玩家,故我们在此认为,如果一局游戏中有50个以上的队伍,说明是单排,有25~50个队伍,说明是双排,有25个以下的队伍,说明是四排。
我们将对数据集进行统计,计算出不同匹配模式的比赛数量:
solos = train[train['numGroups']>50]
duos = train[(train['numGroups']>25) & (train['numGroups']<=50)]
squads = train[train['numGroups']<=25]
print("单排游戏数量和占比:{} ({:.2f}%);双排游戏数量和占比:{} ({:.2f}%); 四排游戏数量和占比:{} ({:.2f}%) ".format(len(solos), 100*len(solos)/len(train), len(duos), 100*len(duos)/len(train), len(squads), 100*len(squads)/len(train),))
运行结果:
单排游戏数量和占比:709111 (15.95%);双排游戏数量和占比:3295326 (74.10%); 四排游戏数量和占比:442529 (9.95%)
在此我们将分析在不同匹配模式下,杀敌数对最终排名的影响,我们将对三种模式下的数据分别进行绘图,并进行对比:
(代码思想:将数据集根据匹配模式进行分类,并对每一类中的杀敌数和排名进行绘图)
f,ax1 = plt.subplots(figsize =(15,10))
sns.pointplot(x='kills',y='winPlacePerc',data=solos,color='red',alpha=0.8)
sns.pointplot(x='kills',y='winPlacePerc',data=duos,color='blue',alpha=0.8)
sns.pointplot(x='kills',y='winPlacePerc',data=squads,color='green',alpha=0.8)
plt.text(37,0.6,'Solos',color='black',fontsize = 17,style = 'italic')
plt.text(37,0.55,'Duos',color='#CC0000',fontsize = 17,style = 'italic')
plt.text(37,0.5,'Squads',color='#3399FF',fontsize = 17,style = 'italic')
plt.xlabel('kill nums',fontsize = 15,color='black')
plt.ylabel('win per',fontsize = 15,color='black')
plt.title('Solo vs Duo vs Squad Kills',fontsize = 20,color='blue')
plt.grid()
plt.show()
运行结果如下:
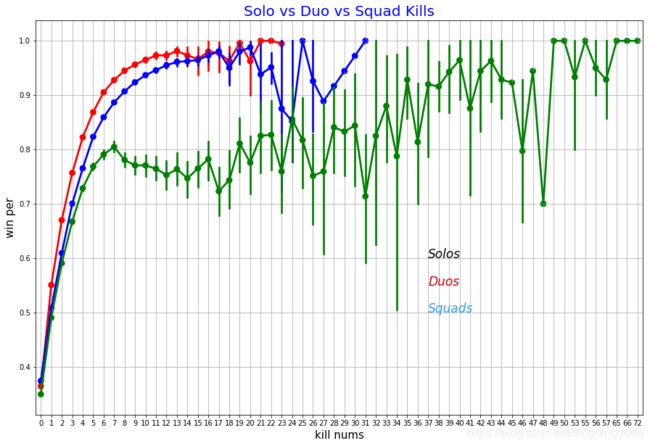
分析可知,单排和双排情况下杀敌数与获胜基本是一致的,也就是通常杀敌较多的队伍更倾向于获胜,获胜概率随着杀敌数的增长显著提升。但是在四排时则与前二者不同,当杀敌数小于10左右时,这种相关性较为明显;但是在杀敌数达到10以上时,获胜概率虽然与杀敌数上虽然有正相关关系,但增长非常缓慢,较为不明显。这是一个挺有意思的现象。
我们认为这个现象的主要原因在于当四排时击倒敌人后队友很可能会救援/扶起。故我们考虑一下不同队伍的击倒敌人数目以及救起队友数目。
f,ax1 = plt.subplots(figsize =(20,10))
#不同模式下击倒敌人数量与获胜概率
sns.pointplot(x='DBNOs',y='winPlacePerc',data=solos,color='red',alpha=0.8)
sns.pointplot(x='DBNOs',y='winPlacePerc',data=duos,color='blue',alpha=0.8)
sns.pointplot(x='DBNOs',y='winPlacePerc',data=squads,color='green',alpha=0.8)
#不同模式下救助队友数量与获胜概率
sns.pointplot(x='revives',y='winPlacePerc',data=solos,color='yellow',alpha=0.8)
sns.pointplot(x='revives',y='winPlacePerc',data=duos,color='orange',alpha=0.8)
sns.pointplot(x='revives',y='winPlacePerc',data=squads,color='black',alpha=0.8)
#记号
plt.text(18,0.5,'Solos - DBNOs',color='red',fontsize = 17,style = 'italic')
plt.text(18,0.45,'Duos - DBNOs',color='blue',fontsize = 17,style = 'italic')
plt.text(18,0.4,'Squads - DBNOs',color='green',fontsize = 17,style = 'italic')

plt.text(18,0.35,'Solos - revives',color='yellow',fontsize = 17,style = 'italic')
plt.text(18,0.3,'Duos - revives',color='orange',fontsize = 17,style = 'italic')
plt.text(18,0.25,'Squads - revives',color='black',fontsize = 17,style = 'italic')

plt.xlabel('Number of DBNOs/Revives',fontsize = 15,color='black')
plt.ylabel('Win Percentage',fontsize = 15,color='black')
plt.title('Duo vs Squad DBNOs and Revives',fontsize = 20,color='black')
plt.grid()
plt.show()
分析:综合来看,在solo和duos模式下,获胜概率随着DBNOs增长而增长;但squads模式中,当DBNOs较小时该增长较为明显,但是当DBNOs大于6时,该增长将不再明显,非常平缓。救援数量则较为有趣,通常救赎数量较高的队伍获胜概率反而会下降,即获胜概率随着救援数量的增加先增后减,对于squads模式该现象尤其明显。
4.多变量综合分析
由于变量诸多,故我们通过绘制变量热力图的方法来得到变量之间的相关性。
heatmap图可以用颜色变化来反映二维矩阵或表格中的数据信息,它可以直观地将数据值的大小以定义的颜色深浅表示出来。根据需要将数据进行聚类,将聚类后的数据表示在heatmap 图上,通过颜色的梯度及相似程度来反映数据的相似性和差异性。
我们对train data绘制heatmap,以反映出综合关系:
f,ax = plt.subplots(figsize=(15, 15))
sns.heatmap(train.corr(), annot=True, linewidths=.5, fmt= '.1f',ax=ax,cmap='rainbow')
plt.show()
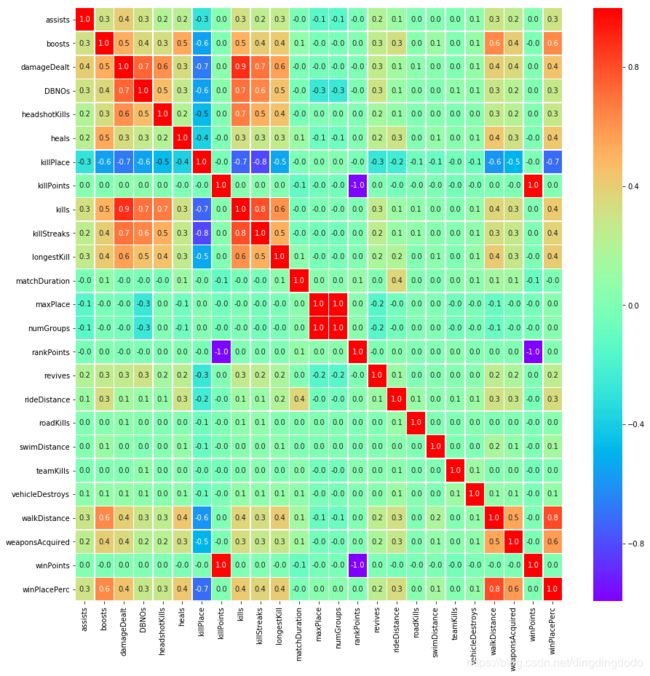
对热力图进行分析,明确我们的目标变量为winPlacePerc,根据热力图我们发现步行距离对winPlacePerc有着最大的正相关影响,而killPlace则有着最大的负相关影响。
为了更为详细的分析,我们在此处仅选取正相关影响大于等于0.4的部分进行分析,共8个变量,分别为boosts、damageDealt、heals、kills、killStreaks、longestkill、walkDistance、weaponsAcquired。我们对该8种变量再做热力图:
k = 9 #变量数量
f,ax = plt.subplots(figsize=(11, 11))
cols = train.corr().nlargest(k, 'winPlacePerc')['winPlacePerc'].index
cm = np.corrcoef(train[cols].values.T)
sns.set(font_scale=1.25)
hm = sns.heatmap(cm, cbar=True, annot=True, square=True, fmt='.2f', annot_kws={'size': 10}, yticklabels=cols.values, xticklabels=cols.values,cmap='rainbow')
plt.show()
结果如下:
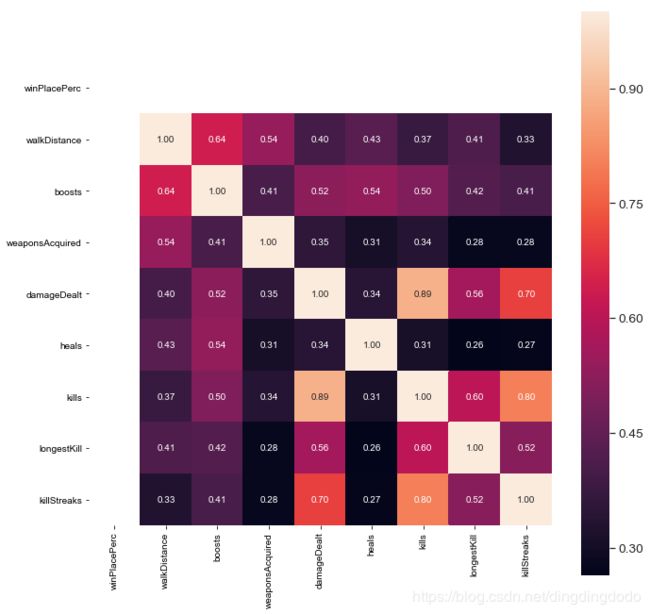
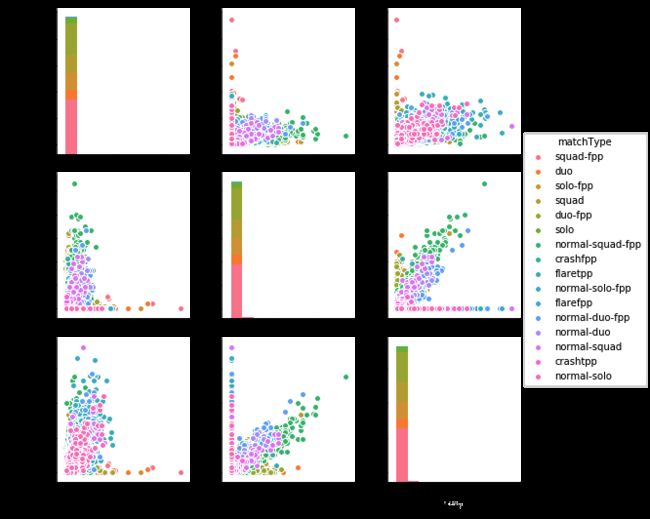
为了更好地得知这些变量之间具体的相关性,我们采用了pairplot图的方式作图:
data = train.loc[:,['weaponsAcquired','DBNOs','kills','matchType']]
sns.pairplot(data,hue='matchType')
通过这些散点图矩阵我们可以看出这些变量之间的具体关系,散点图矩阵是识别分析趋势非常棒的工具。我们能给个看出不同情况下的kills、DBNOs等数据。
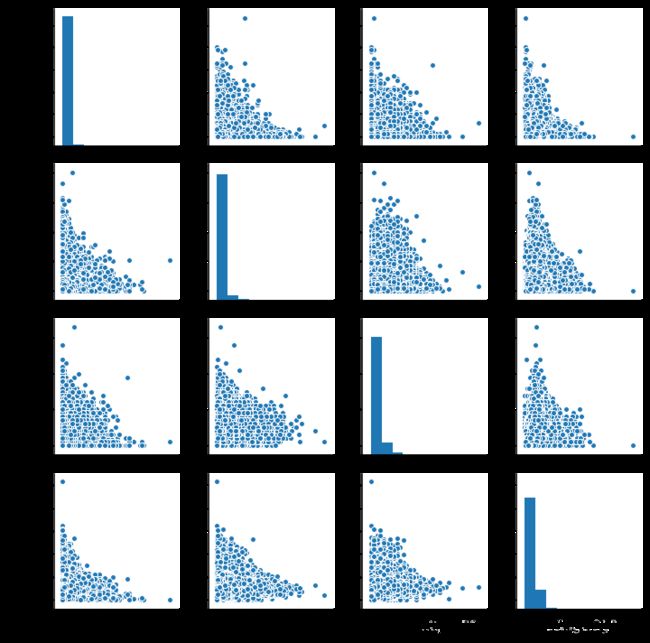
对部分数据用散点图方式做pairplot:
train =train.loc[:,['DBNOs','heals','boosts','walkDistance']]
sns.pairplot(new_data_0)
5.建立模型
基本工作
我们在建立具体模型前先做了一些准备工程,包括读取相关数据、分类相关数据、读取一些重要的信息,以及建立基本的功能函数
def BuildFeature(is_train=True):

    y = None
    test_idx = None

    if is_train:
        print("Reading train.csv")
        df = pd.read_csv('train_V2.csv')
        df = df[df['maxPlace'] > 1]
    else:
        print("Reading test.csv")
        df = pd.read_csv('test_V2.csv')
        test_idx = df.Id

    # Reduce the memory usage
    df = reduce_mem_usage(df)

    print("Delete Unuseful Columns")
    target = 'winPlacePerc'
    features = list(df.columns)
    features.remove("Id")
    features.remove("matchId")
    features.remove("groupId")
    features.remove("matchType")

    if is_train:
        print("Read Labels")
        y = np.array(df.groupby(['matchId','groupId'])[target].agg('mean'), dtype=np.float64)
        features.remove(target)

    print("Read Group mean features")
    agg = df.groupby(['matchId','groupId'])[features].agg('mean')
    agg_rank = agg.groupby('matchId')[features].rank(pct=True).reset_index()
    if is_train:
        df_out = agg.reset_index()[['matchId','groupId']]
    else:
        df_out = df[['matchId','groupId']]
    df_out = df_out.merge(agg.reset_index(), suffixes=["", ""], how='left', on=['matchId', 'groupId'])
    df_out = df_out.merge(agg_rank, suffixes=["_mean", "_mean_rank"], how='left', on=['matchId', 'groupId'])

    print("Read Group max features")
    agg = df.groupby(['matchId','groupId'])[features].agg('max')
    agg_rank = agg.groupby('matchId')[features].rank(pct=True).reset_index()
    df_out = df_out.merge(agg.reset_index(), suffixes=["", ""], how='left', on=['matchId', 'groupId'])
    df_out = df_out.merge(agg_rank, suffixes=["_max", "_max_rank"], how='left', on=['matchId', 'groupId'])

    print("Read Group min features")
    agg = df.groupby(['matchId','groupId'])[features].agg('min')
    agg_rank = agg.groupby('matchId')[features].rank(pct=True).reset_index()
    df_out = df_out.merge(agg.reset_index(), suffixes=["", ""], how='left', on=['matchId', 'groupId'])
    df_out = df_out.merge(agg_rank, suffixes=["_min", "_min_rank"], how='left', on=['matchId', 'groupId'])

    print("Read Group size features")
    agg = df.groupby(['matchId','groupId']).size().reset_index(name='group_size')
    df_out = df_out.merge(agg, how='left', on=['matchId', 'groupId'])

    print("Read Match mean features")
    agg = df.groupby(['matchId'])[features].agg('mean').reset_index()
    df_out = df_out.merge(agg, suffixes=["", "_match_mean"], how='left', on=['matchId'])

    print("Read Match size features")
    agg = df.groupby(['matchId']).size().reset_index(name='match_size')
    df_out = df_out.merge(agg, how='left', on=['matchId'])

    df_out.drop(["matchId", "groupId"], axis=1, inplace=True)
    X = df_out
    feature_names = list(df_out.columns)
    del df, df_out, agg, agg_rank
    gc.collect()

    return X, y, feature_names, test_idx
存取相关的train以及test数据模型:
X_train, y_train, train_columns, _ = BuildFeature(is_train=True)
X_test, _, _ , test_idx = BuildFeature(is_train=False)
运行结果:
Reading train.csv
Memory usage of dataframe is 1017.83 MB
Memory usage after optimization is: 322.31 MB
Decreased by 68.3%
Delete Unuseful Columns
Read Labels
Read Group mean features
Read Group max features
Read Group min features
Read Group size features
Read Match mean features
Read Match size features
Reading test.csv
Memory usage of dataframe is 413.18 MB
Memory usage after optimization is: 121.74 MB
Decreased by 70.5%
Delete Unuseful Columns
Read Group mean features
Read Group max features
Read Group min features
Read Group size features
Read Match mean features
Read Match size features
线性回归
线性回归是利用数理统计中回归分析,来确定两种或两种以上变量间相互依赖的定量关系的一种统计分析方法,同时也是机器学习中最简单的模型,运用十分广泛。考虑数据集D {(x1, y1), (x2, y2), … },我们试图从此数据集中学习得到一个线性模型,这个模型尽可能准确地反应x(i)和y(i)的对应关系。这里的线性模型,就是属性(x)的线性组合的函数,可表示为:
对于数据集D,我们需要根据每组输入(x, y)来计算出线性模型的参数值,即w,b。如果采用最小二乘法作为拟合方法,则是通过下列等式来求得参数值:
这里不妨设
可证明E是关于(w, b)的凸函数,对于凸函数E,关于w,b的导数都为零时,就可得到最优解。
在此基础上,我们使用sklearn建立模型:
from sklearn.linear_model import LinearRegression
LR_model = LinearRegression(n_jobs=4, normalize=True)
LR_model.fit(X_train,y_train)
运行结果:
LinearRegression(copy_X=True, fit_intercept=True, n_jobs=4, normalize=True)
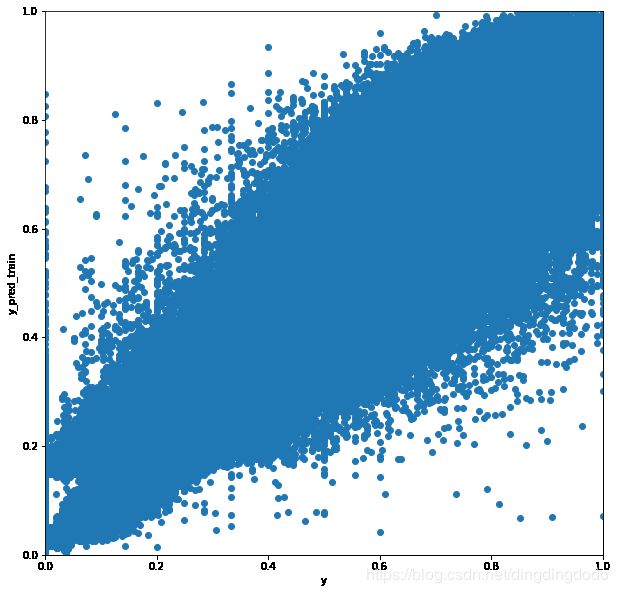
我们查看对训练数据的测试结果,并得出匹配率:
LR_model.score(X_train,y_train)
0.9492056162747164
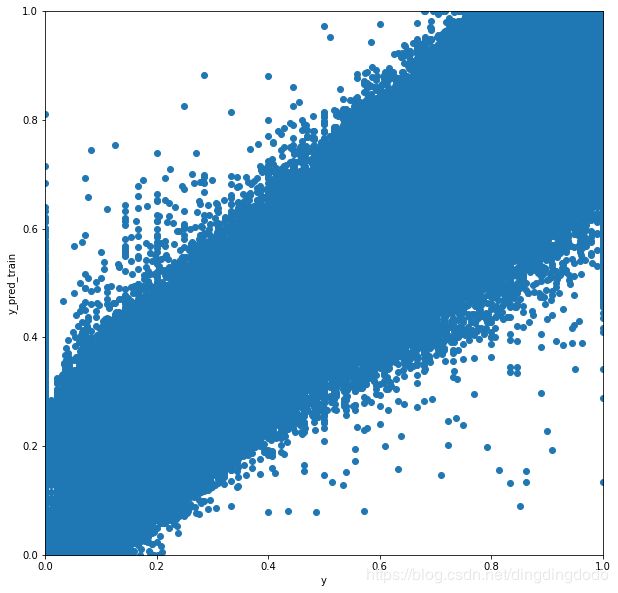
我们在此处对测试集的预测结果进行了可视化:
y_pred_train = LR_model.predict(X_train)
y_pred_test = LR_model.predict(X_test)

y_pred_train[y_pred_train>1] = 1
y_pred_train[y_pred_train<0] = 0

f, ax = plt.subplots(figsize=(10,10))
plt.scatter(y_train, y_pred_train)
plt.xlabel("y")
plt.ylabel("y_pred_train")
plt.xlim([0,1])
plt.ylim([0,1])
plt.show()
之后我们对测试数据集进行测试,效果较差:
df_test['winPlacePerc'] = y_pred_test
submission = df_test[['Id', 'winPlacePerc']]
submission.to_csv('submission_lr.csv', index=False)
测试集上线性回归模型的MAE为0.0445。因为线性回归是一个简单的模型,所以它的性能相对较差。
我们在对数据的探索较为完善的基础上,完成了线性回归预测,之后哦我们将在这个基础上继续进行建立更有效的模型。
神经网络
考虑到线性回归效果较差的原因很可能是变量间的相关性是非线性的(或者说不近似线性),我们尝试用多层神经网络来预测它们之间的关系。
人工神经网络由大量的节点(或称神经元)之间相互联接构成。每个节点代表一种特定的输出函数,称为激励函数。每两个节点间的连接都代表一个对于通过该连接信号的加权值,称之为权重,这相当于人工神经网络的记忆。通过构建输入层、输出层和中间的隐藏层以及每一层中不同数量的神经元,神经网络可以预测复杂变量影响下因变量的行为,这正是我们模型所需要的。
在此处我们又学习了神经网络的方式并用神经网络进行建模。在这一部分中,我们构建了一个具有4个隐藏层的简单神经网络。训练数据集分为训练集和验证集,比例为8:2。MSE用于评估训练集的模型性能, R 2 R^2 R2分数用于评估验证集的性能。经过10次迭代,模型收敛。
Xtrain, ytrain, features = featureExtract('train')
Xtest, _, _ = featureExtract('test')
from sklearn.neural_network import MLPRegressor

clf = MLPRegressor(hidden_layer_sizes=(300, 200, 100, 50, ), activation='relu',
                   solver='adam', alpha=0.0001, batch_size=128,  learning_rate='constant',
                   learning_rate_init=0.001, max_iter=10, shuffle=True, verbose=True,
                   early_stopping=True, validation_fraction=0.2)
clf.fit(Xtrain, ytrain)
Iteration 1, loss = 13.03867796 Validation score: -11.664117
Iteration 2, loss = 0.05291718 Validation score: 0.903167
Iteration 3, loss = 0.02477435 Validation score: -0.000011
Iteration 4, loss = 0.02116714 Validation score: 0.924883
Iteration 5, loss = 0.00290289 Validation score: 0.931118
Iteration 6, loss = 0.00247235 Validation score: 0.952287
Iteration 7, loss = 0.00231838 Validation score: 0.933364
Iteration 8, loss = 0.00225306 Validation score: 0.955590
Iteration 9, loss = 0.00220062 Validation score: 0.950596
Iteration 10, loss = 0.00217747 Validation score: 0.955353
我们对模型进行可视化:
yPred = clf.predict(Xtrain)
yPred[yPred > 1] = 1
yPred[yPred < 0] = 0
plt.figure(figsize=(15, 15))
plt.scatter(ytrain, yPred)
plt.xlabel("y")
plt.ylabel("Predict y")
plt.show()
我们对我们的这个模型进行检测:
Xtrain = None
ytrain = None
yPred = clf.predict(Xtest)
yPred[yPred > 1] = 1
yPred[yPred < 0] = 0
df_test['winPlacePerc'] = yPred
submission = df_test[['Id', 'winPlacePerc']]
submission.to_csv('submission.csv', index=False)
令人失望的是,在此处我们的神经网络模型的MAE仅为0.0452,性能较差。我们认为主要原因是未建立合适的结构,在此处4个较小的隐藏层无法提取较多的有效信息。我们在之后会更加深入研究并采用更合适的结构。
GBR
在之前的基础上,我们采用了GBR(Gradient Boost Regressor)的方式进行建模,用更多的时间和复杂度换取更高的精度。
Boosting这其实思想相当的简单,大概是,对一份数据,建立M个模型(比如分类),一般这种模型比较简单,称为弱分类器。每次分类都将上一次分错的数据权重提高一点再进行分类,这样最终得到的分类器在测试数据与训练数据上都可以得到比较好的成绩。Boosting主要是一种思想,表示“知错就改”。
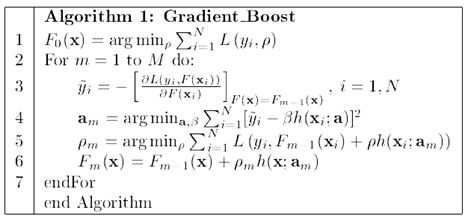
Gradient Boosting是一种Boosting的方法,它主要的思想是,每一次建立模型是在之前建立模型损失函数的梯度下降方向。如果我们的模型能够让损失函数持续的下降,则说明我们的模型在不停的改进,而最好的方式就是让损失函数在其梯度的方向上下降。Gradient Boosting首先将函数分解为可加的形式,然后进行多次迭代,通过使得损失函数在梯度方向上减少,最终得到一个优秀的模型。
具体算法流程在Gradient Boosting Machine一书上有描述
from sklearn.ensemble import GradientBoostingRegressor
GBR = GradientBoostingRegressor(loss='ls',learning_rate=0.1,
                                n_estimators=100,max_depth=3)
GBR.fit(X_train,y_train)
结果:
GradientBoostingRegressor(alpha=0.9, criterion='friedman_mse', init=None,
             learning_rate=0.1, loss='ls', max_depth=3, max_features=None,
             max_leaf_nodes=None, min_impurity_decrease=0.0,
             min_impurity_split=None, min_samples_leaf=1,
             min_samples_split=2, min_weight_fraction_leaf=0.0,
             n_estimators=100, n_iter_no_change=None, presort='auto',
             random_state=None, subsample=1.0, tol=0.0001,
             validation_fraction=0.1, verbose=0, warm_start=False)
查看得分:
GBR.score(X_train,y_train)
对训练数据进行测验,正确率为96%,较线性回归方式有了提升
0.9602893731164401
将预测结果可视化:
y_pred_train = GBR.predict(X_train)
y_pred_test = GBR.predict(X_test)

y_pred_train[y_pred_train>1] = 1
y_pred_train[y_pred_train<0] = 0

f, ax = plt.subplots(figsize=(10,10))
plt.scatter(y_train, y_pred_train)
plt.xlabel("y")
plt.ylabel("y_pred_train")
plt.xlim([0,1])
plt.ylim([0,1])
plt.show()
提交测试数据集:
df_test['winPlacePerc'] = y_pred_test
submission = df_test[['Id', 'winPlacePerc']]
submission.to_csv('submission_gbr.csv', index=False)
测试集上的梯度增强回归树模型的MAE为0.0372。该结果优于线性回归模型和神经网络模型。
Light GBM
与梯度增强回归树模型相比,Light-GBM是一个功能更强大、速度更快的模型,它使用的内存更少,而且精度更高。在传统GBDT的基础上,Light GBM引入了基于梯度的单边采样方法,去除了大部分梯度很小的数据。它只利用剩余数据估计信息增益,避免了低梯度数据的影响。另外,Light-GBM使用互斥特征绑定方法来绑定互斥特征,从而减少特征的数量。
Xtrain, ytrain, features = featureExtract('train')
Xtest, _, _ = featureExtract('test')
import lightgbm as lgb

num = Xtrain.shape[0]
splitnum = int(num*0.8)
idx = np.arange(num)
np.random.shuffle(idx)

trainX = Xtrain[idx[:splitnum]]
trainy = ytrain[idx[:splitnum]]
validX = Xtrain[idx[splitnum:]]
validy = ytrain[idx[splitnum:]]
gc.collect()

def lgbModel(trainX, trainy, validX, validy, testX):
    params = {"objective" : "regression", "metric" : "mae", 'n_estimators':20000,
              'early_stopping_rounds':200, "num_leaves" : 31, "learning_rate" : 0.05,
              "bagging_fraction" : 0.7, "bagging_seed" : 0, "num_threads" : 4,
              "colsample_bytree" : 0.7
             }
    lgbTrain = lgb.Dataset(trainX, label=trainy)
    lgbVal = lgb.Dataset(validX, label=validy)
    model = lgb.train(params, lgbTrain, valid_sets=[lgbTrain, lgbVal],
                      early_stopping_rounds=200, verbose_eval=1000)
    yPredTest = model.predict(testX, num_iteration=model.best_iteration)
    return yPredTest, model
训练模型:
yPred, model = lgbModel(trainX, trainy, validX, validy, Xtest)
Training until validation scores don't improve for 200 rounds.
[1000] training's l1: 0.0282728 valid_1's l1: 0.0287403
[2000] training's l1: 0.0270548 valid_1's l1: 0.0279181
[3000] training's l1: 0.0262728 valid_1's l1: 0.0275007
[4000] training's l1: 0.0256296 valid_1's l1: 0.0272001
[5000] training's l1: 0.0250872 valid_1's l1: 0.0269874
[6000] training's l1: 0.0245968 valid_1's l1: 0.0268052
[7000] training's l1: 0.0241431 valid_1's l1: 0.0266503
[8000] training's l1: 0.0237278 valid_1's l1: 0.0265211
[9000] training's l1: 0.0233331 valid_1's l1: 0.0264009
[10000] training's l1: 0.0229557 valid_1's l1: 0.026291
[11000] training's l1: 0.0225919 valid_1's l1: 0.0261866
[12000] training's l1: 0.0222524 valid_1's l1: 0.0260995
[13000] training's l1: 0.0219172 valid_1's l1: 0.0260056
[14000] training's l1: 0.0215976 valid_1's l1: 0.0259257
[15000] training's l1: 0.0212972 valid_1's l1: 0.0258562
[16000] training's l1: 0.0210015 valid_1's l1: 0.0257848
[17000] training's l1: 0.0207168 valid_1's l1: 0.0257197
[18000] training's l1: 0.0204379 valid_1's l1: 0.0256551
[19000] training's l1: 0.0201651 valid_1's l1: 0.0255966
[20000] training's l1: 0.0199047 valid_1's l1: 0.0255416
我们测试Light GBM的MAE分数:
df_test = reduceMemory(pd.read_csv('test_V2.csv'))
df_test['winPlacePerc'] = yPred
submission = df_test[['Id', 'winPlacePerc']]
submission.to_csv('submission.csv', index=False)
LightGBM模型在试验台上的MAE值为0.0246,在本项目中性能最佳。
模型比较
四个方法的特点以及优缺点分析:
- 线性回归是统计学和机器学习里较为简单的方法,对于线性或近似线性的变量关系能有较好的描述,但由于本次实验变量关系是非线性的,所以效果较差
- 神经网络是通过构建训练神经元结构来处理变量间复杂的关系,他在目前的工业科研届也有着广泛应用。然而在实验中,可能是由于第一次搭建神经网络,我们的最终训练结果较差,推测可能是层数和每层神经元设计的不合理,也有可能是发生过拟合的情况。
- GBR是一种应用多种方法“试错”,并通过学习每次结果并赋以权值,来不断改进自身的算法。这种算法无疑是低效的,实际在计算机上所需的计算时间也远大于线性回归方法。然而诚如参考资料所言,最终学习出的结果也是远超过传统线性回归方法,资料上提到该方法在工业届备受青睐,想必也是因为它较好的训练结果。
- Light GBM是在热门机器学习模型GBDT的改进版,基于Histogram的决策树算法,使得分割的速度和所需内存得到大大优化。同时它抛弃了大多数 GBDT 工具使用的按层生长的决策树生长策略,而使用了带有深度限制的按叶子生长算法,相比于按层生长,在分裂次数相同的情况下,Leaf-wise 可以降低更多的误差,得到更好的精度,同时也能防止过拟合。它的训练速度和精确度都较高,在我们的四种模型中也是最佳的。
总结
我们选取该题目主要是兴趣使然,起初做题时我们有些不知如何下手,故我们对数据进行了简单处理,并进行了数据的探索,通过数据探索我们对一些数据有了较为直观的认识。后来我们通过对变量之间关系的分析以及多变量综合分析,将变量进行了筛选,并集中考虑重要变量。之后我们采用了四种不同的方式进行建模,并最终取得了较好的效果。
由于第一次进行kaggle有些生疏,整个流程没有太好的把控,但是最终还是得出了较为满意的模型。小组成员之间互相协助,完成了任务,之后我们将尝试参加一些不同的相似比赛。
这个过程中,我们对python的数据处理、机器学习、模型建立以及一些统计方法等诸多方面的优势有了非常深刻的认识,并熟悉以及掌握了许多方法。这是我们第一次进行python kaggle比赛,过程较为艰辛,但总体来说收获满满。我们将之后继续深入学习python的相关知识以及深度学习、神经网络等相关知识,并在之后将该模型进一步提升。


