利用Python对美团某商家的评论销售进行数据分析
####导入相关库
from pyecharts import Bar,Pie
import pandas as pd
import numpy as np
import  matplotlib.pyplot as  plt
import time
'''
遇到不懂的问题?Python学习交流群:821460695满足你的需求,资料都已经上传群文件,可以自行下载!
'''
数据清洗与简单统计
- 评论数据,其中包括一下几个字段
- 是否匿名,均价,评价(以去掉,后续会做一些关于这些评论的更为深入的分析),评价时间,交易截止时间,订单号,套餐,上传的图片链接,质量好坏,阅读量,回复量,评分,点赞数等。
df=pd.read_excel("all_data_meituan.xlsx")
df.drop('comment',axis=1).head(2)
df['avgPrice'].value_counts()
# 同一家店的均价应该为同一个数值,所以这列数据没多大的意义
73    17400
Name: avgPrice, dtype: int64
df['anonymous'].value_counts()
# 匿名评价与实名评价的比例大致在5:1左右
False    14402
True      2998
Name: anonymous, dtype: int64
####时间格式的转化
def convertTime(x):
    y=time.localtime(x/1000)
    z=time.strftime("%Y-%m-%d %H:%M:%S",y)
    return z
df["commentTime"]=df["commentTime"].apply(convertTime)
df["commentTime"].head()
0    2018-05-09 22:21:48
1    2018-06-01 19:41:31
2    2018-04-04 11:52:23
3    2018-05-01 17:12:22
4    2018-05-17 16:48:04
Name: commentTime, dtype: object
# 在excel可以用筛选器直接看到这列中的数据含有缺失值,或者在拿到数据的时候,使用df.info() 查看每列的数据信息情况
df['dealEndtime'].isna().value_counts()
# 这列数据中含有177个缺失值,其余完整
False    17223
True       177
Name: dealEndtime, dtype: int64
df['commentTime']=pd.to_datetime(df['commentTime'])
df1 = df.set_index('commentTime')
df1.resample('D').size().sort_values(ascending=False).head(100)
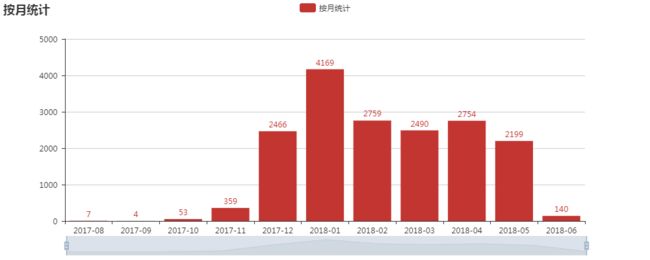
df2=df1.resample('M').size().to_period()
df2=df2.reset_index()
# df2.columns
# from pyecharts import  Bar
bar =Bar("按月统计",width=1000,height=800)
bar.add("按月统计",df2['commentTime'],df2[0],is_label_show=True, is_datazoom_show=True,is_toolbox_show=True,is_more_utils=True)
bar
df['commentTime']=pd.to_datetime(df['commentTime'])
df['weekday'] = df['commentTime'].dt.weekday
df2= df.groupby(['weekday']).size()
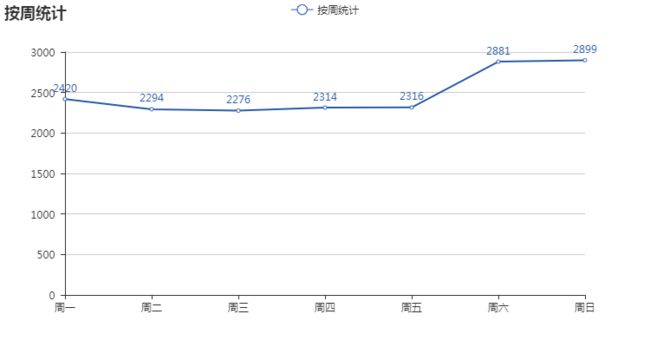
#  周末吃外卖的还是教平时多了一些
from pyecharts import  Bar
bar =Bar("按周统计",width=750,height=400)
weekday=["一","二","三","四","五","六","日"]
bar.add("按周统计",['周{}'.format(i) for i in weekday],df2.values,is_label_show=True, is_datazoom_show=False,is_toolbox_show=True,is_more_utils=True,is_random=True)
bar
df['commentTime']=pd.to_datetime(df['commentTime'])
df['hour'] = df['commentTime'].dt.hour
df2= df.groupby(['hour']).size()
df2
from pyecharts import  Bar
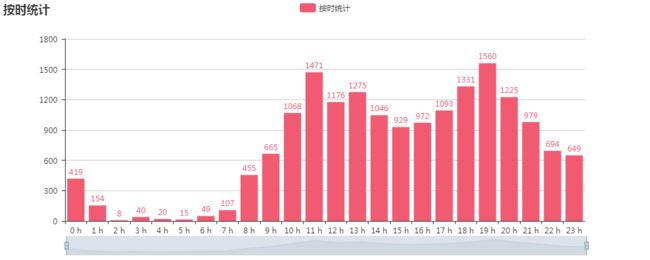
bar =Bar("按时统计",width=1000,height=600)
bar.add("按时统计",['{} h'.format(i) for i in df2.index],df2.values,is_label_show=True, is_datazoom_show=True,is_toolbox_show=True,is_more_utils=True,is_random=True)
bar


