数据科学 案例5 Logistic回归之构建初始信用评级和分类模型检验(代码)
- 8 逻辑回归
- 1、导入数据和数据清洗
- 2、衍生变量:
- 3、分类变量的相关关系
- 4、线性回归
- 4.1 数据预处理(字符型转化为数值型,查看变量间的关系)
- 4.2 随机抽样,建立训练集与测试集
- 4.3 线性回归
- 4.4 预测
- 4.5 模型评估
- 1、设定阈值
- 2、混淆矩阵
- 3、计算准确率
- 4、绘制ROC曲线
- 5、逻辑回归
- 5.1 包含分类预测变量的逻辑回归
- 5.2 多元逻辑回归
- 6、其他变量处理
8 逻辑回归
信用风险建模案例
数据说明:本数据是一份汽车贷款违约数据
#名称—中文含义
#application_id—申请者ID
#account_number—帐户号
#bad_ind—是否违约
#vehicle_year—汽车购买时间
#vehicle_make—汽车制造商
#bankruptcy_ind—曾经破产标识
#tot_derog—五年内信用不良事件数量(比如手机欠费消号)
#tot_tr—全部帐户数量
#age_oldest_tr—最久账号存续时间(月)
#tot_open_tr—在使用帐户数量
#tot_rev_tr—在使用可循环贷款帐户数量(比如信用卡)
#tot_rev_debt—在使用可循环贷款帐户余额(比如信用卡欠款)
#tot_rev_line—可循环贷款帐户限额(信用卡授权额度)
#rev_util—可循环贷款帐户使用比例(余额/限额)
#fico_score—FICO打分
#purch_price—汽车购买金额(元)
#msrp—建议售价
#down_pyt—分期付款的首次交款
#loan_term—贷款期限(月)
#loan_amt—贷款金额
#ltv—贷款金额/建议售价*100
#tot_income—月均收入(元)
#veh_mileage—行使历程(Mile)
#used_ind—是否二手车
#weight—样本权重
import os
import numpy as np
from scipy import stats
import pandas as pd
import statsmodels.api as sm
import statsmodels.formula.api as smf
import matplotlib.pyplot as plt
?pd.read_csv
1、导入数据和数据清洗
表格中有两行列标签(需注意)
accepts = pd.read_csv(r'.\data\accepts.csv',header =1,encoding='gbk')
accepts2 = accepts.drop([5845,5846,11692]).dropna()
accepts2.head()
|
application_id |
account_number |
bad_ind |
vehicle_year |
vehicle_make |
bankruptcy_ind |
tot_derog |
tot_tr |
age_oldest_tr |
tot_open_tr |
... |
purch_price |
msrp |
down_pyt |
loan_term |
loan_amt |
ltv |
tot_income |
veh_mileage |
used_ind |
weight |
| 0 |
2314049 |
11613 |
1 |
1998 |
FORD |
N |
7 |
9 |
64 |
2 |
... |
17200 |
17350 |
0 |
36 |
17200 |
99 |
6550 |
24000 |
1 |
1 |
| 1 |
63539 |
13449 |
0 |
2000 |
DAEWOO |
N |
0 |
21 |
240 |
11 |
... |
19588.54 |
19788 |
683.54 |
60 |
19588.54 |
99 |
4666.67 |
22 |
0 |
4.75 |
| 3 |
8725187 |
15359 |
1 |
1997 |
FORD |
N |
3 |
10 |
35 |
5 |
... |
12999 |
12100 |
3099 |
60 |
10800 |
118 |
1500 |
10000 |
1 |
1 |
| 4 |
4275127 |
15812 |
0 |
2000 |
TOYOTA |
N |
0 |
10 |
104 |
2 |
... |
26328.04 |
22024 |
0 |
60 |
26328.04 |
122 |
4144 |
14 |
0 |
4.75 |
| 5 |
8712513 |
16979 |
0 |
2000 |
DODGE |
Y |
2 |
15 |
136 |
4 |
... |
26272.72 |
26375 |
0 |
36 |
26272.72 |
100 |
5400 |
1 |
0 |
4.75 |
5 rows × 25 columns
accepts2['tot_rev_line'] = accepts2['tot_rev_line'].astype(float)
accepts2['tot_income'] = accepts2['tot_income'].astype(float)
accepts2['loan_amt'] = accepts2['loan_amt'].astype(float)
accepts2['tot_income'] = accepts2['tot_income'].astype(float)
accepts2['down_pyt'] = accepts2['down_pyt'].astype(float)
accepts2['loan_amt'] = accepts2['loan_amt'].astype(float)
accepts2['tot_rev_debt'] = accepts2['tot_rev_debt'].astype(float)
2、衍生变量:
def divMy(x,y):
import numpy as np
if x==np.nan or y==np.nan:
return np.nan
elif y==0:
return -1
else:
return x/y
divMy(1,2)
0.5
accepts2["dti_hist"]=accepts2[["tot_rev_line","tot_income"]].apply(lambda x:divMy(x[0],x[1]),axis = 1)
accepts2["dti_mew"]=accepts2[["loan_amt","tot_income"]].apply(lambda x:divMy(x[0],x[1]),axis = 1)
accepts2["fta"]=accepts2[["down_pyt","loan_amt"]].apply(lambda x:divMy(x[0],x[1]),axis = 1)
accepts2["nth"]=accepts2[["loan_amt","tot_rev_debt"]].apply(lambda x:divMy(x[0],x[1]),axis = 1)
accepts2["nta"]=accepts2[["loan_amt","tot_rev_line"]].apply(lambda x:divMy(x[0],x[1]),axis = 1)
accepts2.head()
|
application_id |
account_number |
bad_ind |
vehicle_year |
vehicle_make |
bankruptcy_ind |
tot_derog |
tot_tr |
age_oldest_tr |
tot_open_tr |
... |
ltv |
tot_income |
veh_mileage |
used_ind |
weight |
dti_hist |
dti_mew |
fta |
nth |
nta |
| 0 |
2314049 |
11613 |
1 |
1998 |
FORD |
N |
7 |
9 |
64 |
2 |
... |
99 |
6550.00 |
24000 |
1 |
1 |
0.076336 |
2.625954 |
0.000000 |
33.992095 |
34.400000 |
| 1 |
63539 |
13449 |
0 |
2000 |
DAEWOO |
N |
0 |
21 |
240 |
11 |
... |
99 |
4666.67 |
22 |
0 |
4.75 |
12.265920 |
4.197541 |
0.034895 |
0.566061 |
0.342212 |
| 3 |
8725187 |
15359 |
1 |
1997 |
FORD |
N |
3 |
10 |
35 |
5 |
... |
118 |
1500.00 |
10000 |
1 |
1 |
3.964000 |
7.200000 |
0.286944 |
2.687236 |
1.816347 |
| 4 |
4275127 |
15812 |
0 |
2000 |
TOYOTA |
N |
0 |
10 |
104 |
2 |
... |
122 |
4144.00 |
14 |
0 |
4.75 |
0.434363 |
6.353292 |
0.000000 |
-1.000000 |
14.626689 |
| 5 |
8712513 |
16979 |
0 |
2000 |
DODGE |
Y |
2 |
15 |
136 |
4 |
... |
100 |
5400.00 |
1 |
0 |
4.75 |
1.064259 |
4.865319 |
0.000000 |
7.196034 |
4.571554 |
5 rows × 30 columns
3、分类变量的相关关系
3.1 交叉表
cross_table = pd.crosstab(accepts2.used_ind,accepts2.bad_ind, margins=True)
cross_table
| bad_ind |
0 |
1 |
All |
| used_ind |
|
|
|
| 0 |
2914 |
612 |
3526 |
| 1 |
3724 |
960 |
4684 |
| All |
6638 |
1572 |
8210 |
3.2 列联表
def percConvert(ser):
return ser/float(ser[-1])
cross_table = pd.crosstab(accepts2.used_ind,accepts2.bad_ind, margins=True)
cross_table.apply(percConvert, axis=1)
| bad_ind |
0 |
1 |
All |
| used_ind |
|
|
|
| 0 |
0.826432 |
0.173568 |
1.0 |
| 1 |
0.795047 |
0.204953 |
1.0 |
| All |
0.808526 |
0.191474 |
1.0 |
print('''chisq = %6.4f
p-value = %6.4f
dof = %i
expected_freq = %s'''  %stats.chi2_contingency(cross_table.iloc[:2, :2]))
chisq = 12.5979
p-value = 0.0004
dof = 1
expected_freq = [[2850.86333739  675.13666261]
 [3787.13666261  896.86333739]]
cross_table = pd.crosstab(accepts2.used_ind,accepts2.bad_ind, margins=False)
cross_table = cross_table.div(cross_table.sum(1),axis = 0)
cross_table
print('''chisq = %6.4f
p-value = %6.4f
dof = %i
expected_freq = %s'''  %stats.chi2_contingency(cross_table.iloc[:2, :2]))
4、线性回归
4.1 数据预处理(字符型转化为数值型,查看变量间的关系)
plt.rcParams['font.sans-serif'] = [u'SimHei']
plt.rcParams['axes.unicode_minus'] = False
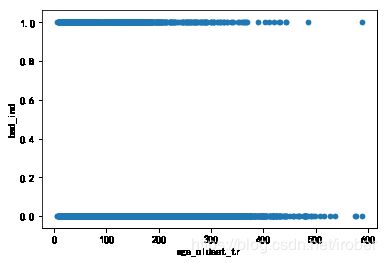
accepts2['age_oldest_tr'] = accepts2['age_oldest_tr'].astype(int)
accepts2['bad_ind'] = accepts2['bad_ind'].astype(int)
accepts2.plot(x = 'age_oldest_tr',y = 'bad_ind', kind = 'scatter')

4.2 随机抽样,建立训练集与测试集
candidates = ['bad_ind','tot_derog','age_oldest_tr','tot_open_tr','rev_util','fico_score','loan_term','ltv',
'veh_mileage','dti_hist','dti_mew','fta','nth','nta']
accepts2[candidates] = accepts2[candidates].astype(float)
train = accepts2.sample(frac=0.7, random_state=1234).copy()
test = accepts2[~ accepts2.index.isin(train.index)].copy()
print(' 训练集样本量: %i \n 测试集样本量: %i' %(len(train), len(test)))
 训练集样本量: 5747
 测试集样本量: 2463
4.3 线性回归
lg = smf.glm('bad_ind ~ age_oldest_tr', data=train,
family=sm.families.Binomial(sm.families.links.logit)).fit()
lg.summary()
Generalized Linear Model Regression Results
| Dep. Variable: |
bad_ind |
No. Observations: |
5747 |
| Model: |
GLM |
Df Residuals: |
5745 |
| Model Family: |
Binomial |
Df Model: |
1 |
| Link Function: |
logit |
Scale: |
1.0000 |
| Method: |
IRLS |
Log-Likelihood: |
-2730.8 |
| Date: |
Sat, 15 Feb 2020 |
Deviance: |
5461.6 |
| Time: |
11:24:04 |
Pearson chi2: |
5.89e+03 |
| No. Iterations: |
5 |
Covariance Type: |
nonrobust |
|
coef |
std err |
z |
P>|z| |
[0.025 |
0.975] |
| Intercept |
-0.5769 |
0.065 |
-8.897 |
0.000 |
-0.704 |
-0.450 |
| age_oldest_tr |
-0.0057 |
0.000 |
-13.682 |
0.000 |
-0.006 |
-0.005 |
4.4 预测
train['proba'] = lg.predict(train)
test['proba'] = lg.predict(test)

test['proba'].head(10)
4     0.237216
10    0.155657
13    0.277338
20    0.060517
22    0.235165
25    0.098014
27    0.050966
32    0.193184
51    0.254062
52    0.318912
Name: proba, dtype: float64
4.5 模型评估
1、设定阈值
test['prediction'] = (test['proba'] > 0.3).astype('int')
2、混淆矩阵
pd.crosstab(test.bad_ind, test.prediction, margins=True)
| prediction |
0 |
1 |
All |
| bad_ind |
|
|
|
| 0.0 |
1877 |
138 |
2015 |
| 1.0 |
366 |
82 |
448 |
| All |
2243 |
220 |
2463 |
3、计算准确率
acc = sum(test['prediction'] == test['bad_ind']) /np.float(len(test))
print('The accurancy is %.2f' %acc)
The accurancy is 0.80
for i in np.arange(0.02, 0.3, 0.02):
prediction = (test['proba'] > i).astype('int')
confusion_matrix = pd.crosstab(prediction,test.bad_ind,
margins = True)
precision = confusion_matrix.loc[0, 0] /confusion_matrix.loc['All', 0]
recall = confusion_matrix.loc[0, 0] / confusion_matrix.loc[0, 'All']
Specificity = confusion_matrix.loc[1, 1] /confusion_matrix.loc[1,'All']
f1_score = 2 * (precision * recall) / (precision + recall)
print('threshold: %s, precision: %.2f, recall:%.2f ,Specificity:%.2f , f1_score:%.2f'%(i, precision, recall, Specificity,f1_score))
threshold: 0.02, precision: 0.00, recall:0.50 ,Specificity:0.18 , f1_score:0.00
threshold: 0.04, precision: 0.01, recall:0.94 ,Specificity:0.18 , f1_score:0.02
threshold: 0.06, precision: 0.03, recall:0.92 ,Specificity:0.18 , f1_score:0.06
threshold: 0.08, precision: 0.07, recall:0.93 ,Specificity:0.19 , f1_score:0.14
threshold: 0.1, precision: 0.13, recall:0.92 ,Specificity:0.19 , f1_score:0.23
threshold: 0.12000000000000001, precision: 0.21, recall:0.92 ,Specificity:0.21 , f1_score:0.34
threshold: 0.13999999999999999, precision: 0.27, recall:0.92 ,Specificity:0.21 , f1_score:0.42
threshold: 0.16, precision: 0.35, recall:0.90 ,Specificity:0.22 , f1_score:0.51
threshold: 0.18, precision: 0.44, recall:0.89 ,Specificity:0.23 , f1_score:0.59
threshold: 0.19999999999999998, precision: 0.56, recall:0.87 ,Specificity:0.24 , f1_score:0.68
threshold: 0.22, precision: 0.68, recall:0.87 ,Specificity:0.27 , f1_score:0.77
threshold: 0.24, precision: 0.76, recall:0.85 ,Specificity:0.28 , f1_score:0.81
threshold: 0.26, precision: 0.83, recall:0.85 ,Specificity:0.32 , f1_score:0.84
threshold: 0.28, precision: 0.88, recall:0.85 ,Specificity:0.34 , f1_score:0.86
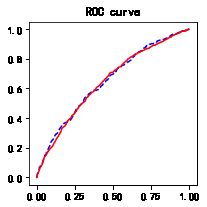
4、绘制ROC曲线
import sklearn.metrics as metrics

fpr_test, tpr_test, th_test = metrics.roc_curve(test.bad_ind, test.proba)
fpr_train, tpr_train, th_train = metrics.roc_curve(train.bad_ind, train.proba)

plt.figure(figsize=[3, 3])
plt.plot(fpr_test, tpr_test, 'b--')
plt.plot(fpr_train, tpr_train, 'r-')
plt.title('ROC curve')
plt.show()
print('AUC = %.4f' %metrics.auc(fpr_test, tpr_test))

AUC = 0.6488
5、逻辑回归
5.1 包含分类预测变量的逻辑回归
formula = '''bad_ind ~ C(used_ind)'''

lg_m = smf.glm(formula=formula, data=train,
             family=sm.families.Binomial(sm.families.links.logit)).fit()
lg_m.summary()
Generalized Linear Model Regression Results
| Dep. Variable: |
bad_ind |
No. Observations: |
5747 |
| Model: |
GLM |
Df Residuals: |
5745 |
| Model Family: |
Binomial |
Df Model: |
1 |
| Link Function: |
logit |
Scale: |
1.0000 |
| Method: |
IRLS |
Log-Likelihood: |
-2836.2 |
| Date: |
Sat, 15 Feb 2020 |
Deviance: |
5672.4 |
| Time: |
11:24:31 |
Pearson chi2: |
5.75e+03 |
| No. Iterations: |
4 |
Covariance Type: |
nonrobust |
|
coef |
std err |
z |
P>|z| |
[0.025 |
0.975] |
| Intercept |
-1.5267 |
0.053 |
-29.060 |
0.000 |
-1.630 |
-1.424 |
| C(used_ind)[T.1] |
0.1927 |
0.068 |
2.838 |
0.005 |
0.060 |
0.326 |
5.2 多元逻辑回归
1、向前法
def forward_select(data, response):
    remaining = set(data.columns)
    remaining.remove(response)
    selected = []
    current_score, best_new_score = float('inf'), float('inf')
    while remaining:
        aic_with_candidates=[]
        for candidate in remaining:
            formula = "{} ~ {}".format(
                response,' + '.join(selected + [candidate]))
            aic = smf.glm(
                formula=formula, data=data,
                family=sm.families.Binomial(sm.families.links.logit)
            ).fit().aic
            aic_with_candidates.append((aic, candidate))
        aic_with_candidates.sort(reverse=True)
        best_new_score, best_candidate=aic_with_candidates.pop()
        if current_score > best_new_score:
            remaining.remove(best_candidate)
            selected.append(best_candidate)
            current_score = best_new_score
            print ('aic is {},continuing!'.format(current_score))
        else:
            print ('forward selection over!')
            break

    formula = "{} ~ {} ".format(response,' + '.join(selected))
    print('final formula is {}'.format(formula))
    model = smf.glm(
        formula=formula, data=data,
        family=sm.families.Binomial(sm.families.links.logit)
    ).fit()
    return(model)
candidates = ['bad_ind','tot_derog','age_oldest_tr','tot_open_tr','rev_util','fico_score','loan_term','ltv',
'veh_mileage','dti_hist','dti_mew','fta','nth','nta']
data_for_select = train[candidates]
lg_m1 = forward_select(data=data_for_select, response='bad_ind')
lg_m1.summary()
aic is 5112.102444955438,continuing!
aic is 4930.620746960663,continuing!
aic is 4867.936361578135,continuing!
aic is 4862.177989178937,continuing!
aic is 4856.0240437714365,continuing!
aic is 4853.140577715231,continuing!
aic is 4851.285414957676,continuing!
forward selection over!
final formula is bad_ind ~ fico_score + ltv + age_oldest_tr + rev_util + nth + tot_derog + fta
Generalized Linear Model Regression Results
| Dep. Variable: |
bad_ind |
No. Observations: |
5747 |
| Model: |
GLM |
Df Residuals: |
5739 |
| Model Family: |
Binomial |
Df Model: |
7 |
| Link Function: |
logit |
Scale: |
1.0000 |
| Method: |
IRLS |
Log-Likelihood: |
-2417.6 |
| Date: |
Sat, 15 Feb 2020 |
Deviance: |
4835.3 |
| Time: |
11:24:47 |
Pearson chi2: |
5.60e+03 |
| No. Iterations: |
6 |
Covariance Type: |
nonrobust |
|
coef |
std err |
z |
P>|z| |
[0.025 |
0.975] |
| Intercept |
5.6094 |
0.591 |
9.491 |
0.000 |
4.451 |
6.768 |
| fico_score |
-0.0139 |
0.001 |
-16.606 |
0.000 |
-0.015 |
-0.012 |
| ltv |
0.0278 |
0.002 |
11.201 |
0.000 |
0.023 |
0.033 |
| age_oldest_tr |
-0.0035 |
0.000 |
-7.929 |
0.000 |
-0.004 |
-0.003 |
| rev_util |
0.0010 |
0.000 |
2.564 |
0.010 |
0.000 |
0.002 |
| nth |
0.0004 |
0.000 |
2.529 |
0.011 |
8.63e-05 |
0.001 |
| tot_derog |
0.0253 |
0.011 |
2.271 |
0.023 |
0.003 |
0.047 |
| fta |
-0.6570 |
0.349 |
-1.880 |
0.060 |
-1.342 |
0.028 |
2、计算方差膨胀因子
def vif(df, col_i):
from statsmodels.formula.api import ols
cols = list(df.columns)
cols.remove(col_i)
cols_noti = cols
formula = col_i + '~' + '+'.join(cols_noti)
r2 = ols(formula, df).fit().rsquared
return 1. / (1. - r2)
candidates = ['bad_ind','fico_score','ltv','age_oldest_tr','tot_derog','nth','tot_open_tr','veh_mileage','rev_util']
exog = train[candidates].drop(['bad_ind'], axis=1)

for i in exog.columns:
    print(i, '\t', vif(df=exog, col_i=i))
fico_score 	 1.6474312909303999
ltv 	 1.0312076990808654
age_oldest_tr 	 1.2398180183116478
tot_derog 	 1.387916859405689
nth 	 1.019005900596472
tot_open_tr 	 1.130385791173031
veh_mileage 	 1.0249442971334133
rev_util 	 1.0857772491871416
train['proba'] = lg_m1.predict(train)
test['proba'] = lg_m1.predict(test)
import sklearn.metrics as metrics
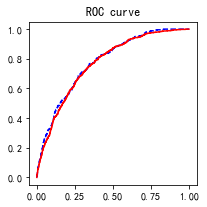
fpr_test, tpr_test, th_test = metrics.roc_curve(test.bad_ind, test.proba)
fpr_train, tpr_train, th_train = metrics.roc_curve(train.bad_ind, train.proba)
plt.figure(figsize=[3, 3])
plt.plot(fpr_test, tpr_test, 'b--')
plt.plot(fpr_train, tpr_train, 'r-')
plt.title('ROC curve')
plt.show()
print('AUC = %.4f' %metrics.auc(fpr_test, tpr_test))

AUC = 0.7756
6、其他变量处理
目前vehicle_year、vehicle_make、bankruptcy_ind、used_ind这些分类变量无法通过逐步变量筛选法
解决方案:
- 1、逐一根据显著性测试
- 2、使用决策树等方法筛选变量,但是多分类变量需要事先进行变量概化
- 3、使用WOE转换,多分类变量也需要事先进行概化,使用scorecardpy包中的woe算法可以自动进行概化
使用第一种方法
formula = '''bad_ind ~ fico_score+ltv+age_oldest_tr+tot_derog+nth+tot_open_tr+veh_mileage+rev_util+C(bankruptcy_ind)'''
lg_m = smf.glm(formula=formula, data=train,
family=sm.families.Binomial(sm.families.links.logit)).fit()
lg_m.summary()
Generalized Linear Model Regression Results
| Dep. Variable: |
bad_ind |
No. Observations: |
5747 |
| Model: |
GLM |
Df Residuals: |
5737 |
| Model Family: |
Binomial |
Df Model: |
9 |
| Link Function: |
logit |
Scale: |
1.0000 |
| Method: |
IRLS |
Log-Likelihood: |
-2416.0 |
| Date: |
Sat, 15 Feb 2020 |
Deviance: |
4832.0 |
| Time: |
11:44:38 |
Pearson chi2: |
5.54e+03 |
| No. Iterations: |
6 |
Covariance Type: |
nonrobust |
|
coef |
std err |
z |
P>|z| |
[0.025 |
0.975] |
| Intercept |
5.4394 |
0.596 |
9.122 |
0.000 |
4.271 |
6.608 |
| C(bankruptcy_ind)[T.Y] |
-0.3261 |
0.136 |
-2.397 |
0.017 |
-0.593 |
-0.059 |
| fico_score |
-0.0138 |
0.001 |
-16.393 |
0.000 |
-0.015 |
-0.012 |
| ltv |
0.0290 |
0.002 |
12.024 |
0.000 |
0.024 |
0.034 |
| age_oldest_tr |
-0.0034 |
0.000 |
-7.282 |
0.000 |
-0.004 |
-0.002 |
| tot_derog |
0.0330 |
0.012 |
2.788 |
0.005 |
0.010 |
0.056 |
| nth |
0.0004 |
0.000 |
2.617 |
0.009 |
9.82e-05 |
0.001 |
| tot_open_tr |
-0.0103 |
0.012 |
-0.866 |
0.387 |
-0.034 |
0.013 |
| veh_mileage |
8.365e-07 |
1.17e-06 |
0.713 |
0.476 |
-1.46e-06 |
3.14e-06 |
| rev_util |
0.0011 |
0.000 |
2.610 |
0.009 |
0.000 |
0.002 |


