人工智能与机器学习中模型评估与旋转概念及编程完成对手写体Mnist数据集中10个字符(0-9)的识别
机器学习概念及分类识别 目录
- 一、阅读“机器学习”(周志华著)第二章“模型评估与旋转”,理解“查准率”、“查全率”、“F1-Score”、“ROC”、“混淆矩阵”的定义。
- 1. 查准率
- 2. 查全率
- 3. F1-Score
- 4. ROC
- 5. 混淆矩阵
- 二、学习“机器学习实战”第三章-分类器,Jupyter编程完成对手写体Mnist数据集中10个字符 (0-9)的分类识别
- 1. 获取MNIST数据集
- 2. 显示获取数据集需要的时间
- 3. 数据集排序,生成矩阵
- 4. 显示图片
- 5. 完成对手写体Mnist数据集中10个字符 (0-9)的分类识别
- 6. 创建测试集
- 7. 训练一个二分类器
- 8. 性能考核
- 9. 混淆矩阵
- 10. 精度/召回率权衡
一、阅读“机器学习”(周志华著)第二章“模型评估与旋转”,理解“查准率”、“查全率”、“F1-Score”、“ROC”、“混淆矩阵”的定义。
1. 查准率
- 根据百度百科定义:
查准率(Precision)(精度)是衡量某一检索系统的信号噪声比的一种指标,即检出的相关文献与检出的全部文献的百分比。
普遍表示为:查准率=(检索出的相关信息量/检索出的信息总量)x100%。
而查准率P可以表示为:
P = T P T P + F P P=\frac {TP}{TP+FP} P=TP+FPTP
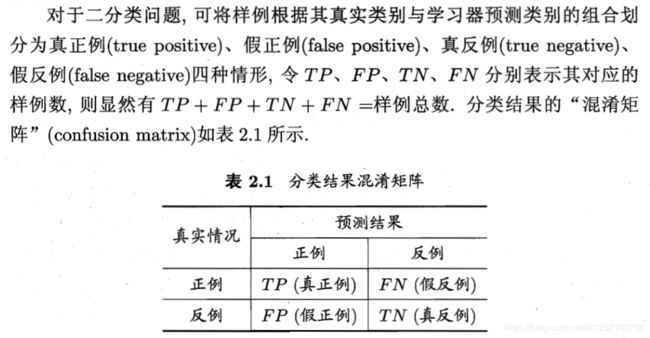
其中TP,FP的定义在上面前提的图中。
但对其的理解,我也不是很懂,概念上的东西,还是比较抽象的。
2. 查全率
百度百科定义:
查全率(Recall Ratio)是指从数据库内检出的相关的信息量与总量的比率。查全率绝对值很难计算,只能根据数据库内容、数量来估算。
查全率是衡量某一检索系统从文献集合中检出相关文献成功度的一项指标,即检出的相关文献与全部相关文献的百分比。
其中查全率R可以表示为:
R = T P T P + F N R=\frac {TP}{TP+FN} R=TP+FNTP
其中TP,FN的定义在上面前提的图中。
总结来说,查准率和查全率是一对矛盾的度量,一般来说,查准率高时,查全率往往偏低;而查全率高时,查准率往往偏低。
3. F1-Score
相对于平衡点度量BEP(就是“查准率=查全率”时的取值),我们更加常用F1度量:
F 1 = 2 × P × R P + R = 2 × T P 样 例 总 数 + T P − T N F1 = \frac {2×P×R}{P+R}=\frac {2×TP}{样例总数+TP-TN} F1=P+R2×P×R=样例总数+TP−TN2×TP
F1度量的一般形式—— F β F_\beta Fβ,能让我们表达出对查准率和查全率的不同偏好,定义为:
F β = ( 1 + β 2 ) × P × R ( β 2 × P ) + R F_\beta=\frac{(1+\beta^2)×P×R}{(\beta^2×P)+R} Fβ=(β2×P)+R(1+β2)×P×R
其中 β > 0 \beta>0 β>0度量了查全率对查准率的相对重要性。
4. ROC
ROC全称是“受试者工作特征(Receiver Operating Characteristic)”。其主要分析工具是一个画在二维平面上的曲线——ROC 曲线。平面的横坐标是false positive rate(FPR),纵坐标是true positive rate(TPR)
其中二者分别定义为:
T P R = T P T P + F N , TPR=\frac{TP}{TP+FN}, TPR=TP+FNTP, F P R = F P T N + F P . FPR=\frac{FP}{TN+FP}. FPR=TN+FPFP.
5. 混淆矩阵
百度百科定义:
混淆矩阵也称误差矩阵,是表示精度评价的一种标准格式,用n行n列的矩阵形式来表示。具体评价指标有总体精度、制图精度、用户精度等,这些精度指标从不同的侧面反映了图像分类的精度。
在人工智能中,混淆矩阵(confusion matrix)是可视化工具,特别用于监督学习,在无监督学习一般叫做匹配矩阵。
在图像精度评价中,主要用于比较分类结果和实际测得值,可以把分类结果的精度显示在一个混淆矩阵里面。混淆矩阵是通过将每个实测像元的位置和分类与分类图像中的相应位置和分类相比较计算的。
混淆矩阵的每一列代表了预测类别,每一列的总数表示预测为该类别的数据的数目;每一行代表了数据的真实归属类别,每一行的数据总数表示该类别的数据实例的数目。
二、学习“机器学习实战”第三章-分类器,Jupyter编程完成对手写体Mnist数据集中10个字符 (0-9)的分类识别
1. 获取MNIST数据集
# 使用sklearn的函数来获取MNIST数据集
from sklearn.datasets import fetch_openml
import numpy as np
import os
# to make this notebook's output stable across runs
np.random.seed(42)
# To plot pretty figures
%matplotlib inline
import matplotlib as mpl
import matplotlib.pyplot as plt
mpl.rc('axes', labelsize=14)
mpl.rc('xtick', labelsize=12)
mpl.rc('ytick', labelsize=12)
# 为了显示中文
mpl.rcParams['font.sans-serif'] = [u'SimHei']
mpl.rcParams['axes.unicode_minus'] = False
# 耗时巨大
def sort_by_target(mnist):
    reorder_train=np.array(sorted([(target,i) for i, target in enumerate(mnist.target[:60000])]))[:,1]
    reorder_test=np.array(sorted([(target,i) for i, target in enumerate(mnist.target[60000:])]))[:,1]
    mnist.data[:60000]=mnist.data[reorder_train]
    mnist.target[:60000]=mnist.target[reorder_train]
    mnist.data[60000:]=mnist.data[reorder_test+60000]
    mnist.target[60000:]=mnist.target[reorder_test+60000]
2. 显示获取数据集需要的时间
import time
start = time.clock()

mnist=fetch_openml('mnist_784',version=1,cache=True)
mnist.target=mnist.target.astype(np.int8)
sort_by_target(mnist)

stop = time.clock()
print("花费的时间为(s):",(stop - start))
3. 数据集排序,生成矩阵
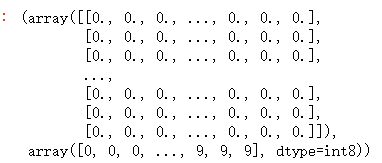
mnist["data"], mnist["target"]
# 方法一
# mnist.data.shape
# 方法二
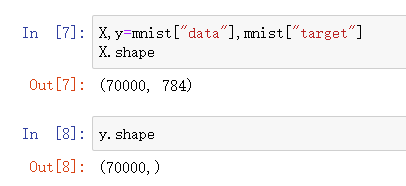
X,y=mnist["data"],mnist["target"]
X.shape
4. 显示图片
# 展示图片
def plot_digit(data):
    image = data.reshape(28, 28)
    plt.imshow(image, cmap = mpl.cm.binary,
               interpolation="nearest")
    plt.axis("off")
# some_digit = X[36000]
# plot_digit(X[36000].reshape(28,28))
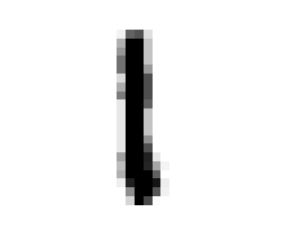
some_digit = X[61000]
plot_digit(X[61000].reshape(28,28))
y[61000]
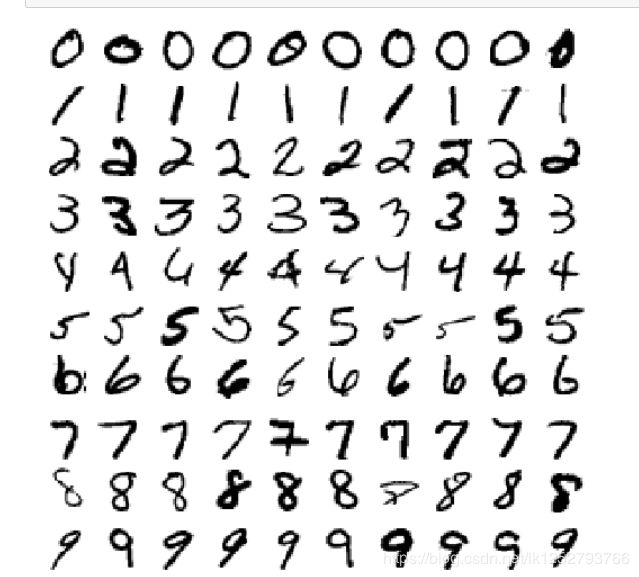
5. 完成对手写体Mnist数据集中10个字符 (0-9)的分类识别
# 更好看的图片展示
def plot_digits(instances,images_per_row=10,**options):
    size=28
    # 每一行有一个
    image_pre_row=min(len(instances),images_per_row)
    images=[instances.reshape(size,size) for instances in instances]
#     有几行
    n_rows=(len(instances)-1) // image_pre_row+1
    row_images=[]
    n_empty=n_rows*image_pre_row-len(instances)
    images.append(np.zeros((size,size*n_empty)))
    for row in range(n_rows):
        # 每一次添加一行
        rimages=images[row*image_pre_row:(row+1)*image_pre_row]
        # 对添加的每一行的额图片左右连接
        row_images.append(np.concatenate(rimages,axis=1))
    # 对添加的每一列图片 上下连接
    image=np.concatenate(row_images,axis=0)
    plt.imshow(image,cmap=mpl.cm.binary,**options)
    plt.axis("off")
plt.figure(figsize=(9,9))
example_images=np.r_[X[:12000:600],X[13000:30600:600],X[30600:60000:590]]
plot_digits(example_images,images_per_row=10)
plt.show()
6. 创建测试集
X_train, X_test, y_train, y_test = X[:60000], X[60000:], y[:60000], y[60000:]
# 对训练集进行洗牌,这样可以保证交叉验证的时候,所有的折叠都差不多
import numpy as np

shuffer_index=np.random.permutation(60000)
X_train,y_train=X_train[shuffer_index],y_train[shuffer_index]
7. 训练一个二分类器
y_train_5=(y_train==5)
y_test_5=(y_test==5)
# 一个好的选择是随机梯度下降(SGD)分类器,使用sklearn的SGDClassifier类即可
from sklearn.linear_model import SGDClassifier

sgd_clf=SGDClassifier(max_iter=5,tol=-np.infty,random_state=42)
sgd_clf.fit(X_train,y_train_5)
8. 性能考核
from sklearn.model_selection import cross_val_score
cross_val_score(sgd_clf, X_train, y_train_5, cv=3, scoring="accuracy")
9. 混淆矩阵
评估分类器性能的更好的方法是混淆矩阵。总体思路就是统计A类别实例被分成B类别的次数。例如,要想知道分类器将数字3和数字5混淆多少次,只需要通过混淆矩阵的第5行第3列来查看。
要计算混淆矩阵,需要一组预测才能将其与实际目标进行比较。当然可以通过测试集来进行预测,但是现在我们不动它(测试集最好保留到项目的最后,准备启动分类器时再使用)。最为代替,可以使用cross_val_predict()函数:
cross_val_predict 和 cross_val_score 不同的是,前者返回预测值,并且是每一次训练的时候,用模型没有见过的数据来预测
代码:
from sklearn.model_selection import cross_val_predict

y_train_pred = cross_val_predict(sgd_clf, X_train, y_train_5, cv=3)

from sklearn.metrics import confusion_matrix

confusion_matrix(y_train_5, y_train_pred)
10. 精度/召回率权衡
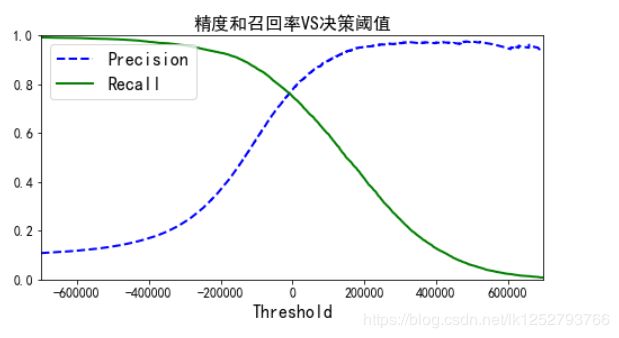
在分类中,对于每个实例,都会计算出一个分值,同时也有一个阈值,大于为正例,小于为负例。通过调节这个阈值,可以调整精度和召回率。
y_scores = sgd_clf.decision_function([some_digit])
y_scores

threshold = 0
y_some_digit_pred = (y_scores > threshold)
y_some_digit_pred

threshold = 200000
y_some_digit_pred = (y_scores > threshold)
y_some_digit_pred

# 返回决策分数,而不是预测结果
y_scores = cross_val_predict(sgd_clf, X_train, y_train_5, cv=3,
                             method="decision_function")
y_scores.shape

from sklearn.metrics import precision_recall_curve

precisions, recalls, thresholds = precision_recall_curve(y_train_5, y_scores)
def plot_precision_recall_vs_threshold(precisions, recalls, thresholds):
    plt.plot(thresholds, precisions[:-1], "b--", label="Precision", linewidth=2)
    plt.plot(thresholds, recalls[:-1], "g-", label="Recall", linewidth=2)
    plt.xlabel("Threshold", fontsize=16)
    plt.title("精度和召回率VS决策阈值", fontsize=16)
    plt.legend(loc="upper left", fontsize=16)
    plt.ylim([0, 1])

plt.figure(figsize=(8, 4))
plot_precision_recall_vs_threshold(precisions, recalls, thresholds)
plt.xlim([-700000, 700000])
plt.show()
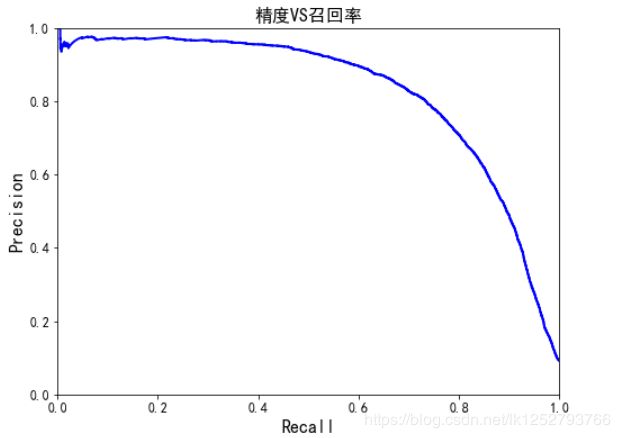
def plot_precision_vs_recall(precisions, recalls):
    plt.plot(recalls, precisions, "b-", linewidth=2)
    plt.xlabel("Recall", fontsize=16)
    plt.title("精度VS召回率", fontsize=16)
    plt.ylabel("Precision", fontsize=16)
    plt.axis([0, 1, 0, 1])

plt.figure(figsize=(8, 6))
plot_precision_vs_recall(precisions, recalls)
plt.show()
