R语言中的多类别问题的绩效衡量:F1-score 和广义AUC
原文链接:http://tecdat.cn/?p=11160
对于分类问题,通常根据与分类器关联的混淆矩阵来定义分类器性能。根据混淆矩阵 ,可以计算灵敏度(召回率),特异性和精度。
对于二进制分类问题,所有这些性能指标都很容易获得。
非得分分类器的数据
为了展示多类别设置中非得分分类器的性能指标,让我们考虑观察到\(N = 100 \)的分类问题和观察到\(G = \ {1,\ ldots,5 \}的五个分类问题\):
ref.labels <- c(rep("A", 45), rep("B" , 10), rep("C", 15), rep("D", 25), rep("E", 5))
predictions <- c(rep("A", 35), rep("E", 5), rep("D", 5),
                 rep("B", 9), rep("D", 1),
                 rep("C", 7), rep("B", 5), rep("C", 3),
                 rep("D", 23), rep("C", 2),
                 rep("E", 1), rep("A", 2), rep("B", 2))
df <- data.frame("Prediction" = predictions, "Reference" = ref.labels)
准确性和加权准确性
通常,将多类准确性定义为正确预测的平均数:
其中\(I \)是指标函数,如果类匹配,则返回1,否则返回0。
为了对各个类的性能更加敏感,我们可以为每个类分配权重\(w_k \),以使\(\ sum_ {k = 1} ^ {| G |} w_k = 1 \)。单个类别的\(w_k \)值越高,该类别的观测值对加权准确性的影响就越大。加权精度取决于:
为了平均加权所有类,我们可以设置\(w_k = \ frac {1} {| G |} \,\ forall k \ in \ {1,\ ldots,G \} \)。注意,当使用除均等权重之外的任何其他值时,很难找到关于权重的特定组合的合理论证。
计算精度和加权精度
精度很容易计算:
calculate.accuracy <- function(predictions, ref.labels) {
    return(length(which(predictions == ref.labels)) / length(ref.labels))
}
calculate.w.accuracy <- function(predictions, ref.labels, weights) {
    lvls <- levels(ref.labels)
    if (length(weights) != length(lvls)) {
        stop("Number of weights should agree with the number of classes.")
    }
    if (sum(weights) != 1) {
        stop("Weights do not sum to 1")
    }
    accs <- lapply(lvls, function(x) {
        idx <- which(ref.labels == x)
        return(calculate.accuracy(predictions[idx], ref.labels[idx]))
    })
    acc <- mean(unlist(accs))
    return(acc)
}
acc <- calculate.accuracy(df$Prediction, df$Reference)
print(paste0("Accuracy is: ", round(acc, 2)))
## [1] "Accuracy is: 0.78"## [1] "Weighted accuracy is: 0.69"
F1分数的微观和宏观平均值
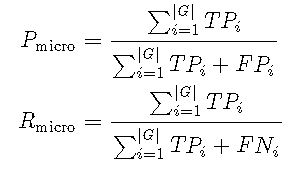
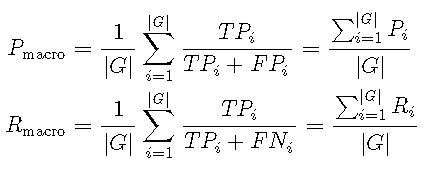
微观平均值和宏观平均值表示在多类设置中解释混淆矩阵的两种方式。在这里,我们需要为每个类\(g_i \ in G = \ {1,\ ldots,K \} \)计算一个混淆矩阵,以使第\(i \)个混淆矩阵考虑类\(g_i \)作为肯定类,而所有其他类\(g_j \)作为\(j \ neq i \)作为否定类。
为了说明为什么增加真实负数会带来问题,请想象有10个类别,每个类别有10个观察值。然后,其中一个类别的混淆矩阵可能具有以下结构:
| 预测/参考 | 1类 | 其他类 |
|---|---|---|
| 1类 | 8 | 10 |
| 其他类 | 2 | 80 |
基于此矩阵,特异性将为\(\ frac {80} {80 + 10} = 88.9 \%\),尽管仅在18个实例中的8个实例中正确预测了1类(精度为44.4%)。
在下文中,我们将使用\(TP_i \),\(FP_i \)和\(FN_i \)分别在与第(i)个相关联的混淆矩阵中指示真阳性,假阳性和假阴性类。此外,让精度由\(P \)表示,并由\(R \)表示。
计算R中的微观和宏观平均值
在这里,我演示了如何在R中计算F1分数的微观平均值和宏观平均值。
我们将使用 包中的 confusionMatrix 函数 caret来确定混淆矩阵:
现在, 我们可以总结所有类的性能:
metrics <- c("Precision", "Recall")
print(cm[[1]]$byClass[, metrics])
## Precision Recall
## Class: A 0.9459459 0.7777778
## Class: B 0.5625000 0.9000000
## Class: C 0.8333333 0.6666667
## Class: D 0.7931034 0.9200000
## Class: E 0.1666667 0.2000000这些数据表明,总体而言,性能很高。但是,我们的假设分类器对于单个类别(如B类(精度)和E类(精度和查全率))的表现不佳。现在,我们将研究F1得分的微观平均值和宏观平均值如何受到模型预测的影响。
微型平均F1的总体性能
get.micro.f1 然后,该函数 简单地汇总计数并计算如上定义的F1分数。
micro.f1 <- get.micro.f1(cm)
print(paste0("Micro F1 is: ", round(micro.f1, 2)))
## [1] "Micro F1 is: 0.88" 值为 0.88\(F_1 {\ rm {micro}} \)相当高,表明整体性能良好。
宏平均F1的类特定性能
由于其中的每个混淆矩阵都 cm 已经存储了一对多的预测性能,因此我们只需要从其中一个矩阵中提取这些值,然后按上述定义计算\(F1 _ {\ rm {macro}} \):
get.macro.f1 <- function(cm) {
    c <- cm[[1]]$byClass # a single matrix is sufficient
    re <- sum(c[, "Recall"]) / nrow(c)
    pr <- sum(c[, "Precision"]) / nrow(c)
    f1 <- 2 * ((re * pr) / (re + pr))
    return(f1)
}
macro.f1 <- get.macro.f1(cm)
print(paste0("Macro F1 is: ", round(macro.f1, 2)))
## [1] "Macro F1 is: 0.68" 值 0.68,\(F _ {\ RM {宏}} \)是断然比更小的微平均F1( 0.88)。
请注意,对于当前数据集,微观平均和宏观平均F1的总体(0.78)和加权精度(0.69)具有相似的关系。
精确调用曲线和AUC
ROC曲线下的面积(AUC)是评估软分类器分类分离质量的有用工具。在多类别设置中,我们可以根据它们对所有精度召回曲线的关系可视化多类别模型的性能。AUC也可以推广到多类别设置。
一对一的精确召回曲线
我们可以通过绘制\(K \)二进制分类器的性能来可视化多类模型的性能。
该方法基于拟合\(K \)对所有分类器,其中在第(i)次迭代中,组(g_i \)设置为正类,而所有类((g_j \))与\(j \ neq i \)一起被视为否定类。请注意,此方法不应用于绘制常规ROC曲线(TPR与FPR),因为由于去二甲亚胺而产生的大量负面实例会导致FPR被低估。相反,应考虑精度和召回率:
for (i in seq_along(levels(response))) {

  model <- NaiveBayes(binary.labels ~ ., data = iris.train[, -5])
  pred <- predict(model, iris.test[,-5], type='raw')
  score <- pred$posterior[, 'TRUE'] # posterior for  positive class
  test.labels <- iris.test$Species == cur.class
  pred <- prediction(score, test.labels)
  perf <- performance(pred, "prec", "rec")
  roc.x <- unlist([email protected])
  roc.y <- unlist([email protected])
  lines(roc.y ~ roc.x, col = colors[i], lwd = 2)
  # store AUC
  auc <- performance(pred, "auc")
  auc <- unlist(slot(auc, "y.values"))
  aucs[i] <- auc
}
print(paste0("Mean AUC under the precision-recall curve is: ", round(mean(aucs), 2)))## [1] "Mean AUC under the precision-recall curve is: 0.97"该图表明 setosa 可以很好地预测,而 virginica 则更难预测。 平均AUC 0.97 表示该模型很好地分隔了三个类别。
多类设置的AUC通用化
单个决策值的广义AUC
当单个数量允许分类时,可使用包装中的 multiclass.roc 功能 pROC确定AUC。
## Multi-class area under the curve: 0.654函数的计算出的AUC只是所有成对类别比较中的平均值AUC。
广义AUC
下面从Hand and Till,2001开始描述AUC的一般化 。
似乎由于Hand and Till(2001),没有公开可用的AUC多类概括的实现。因此,我编写了一个实现。该函数 compute.A.conditional 确定\(\ hat {A}(i | j)\)。该 multiclass.auc 函数为所有具有\(i
multiclass.auc <- function(pred.matrix, ref.outcome) {
    labels <- colnames(pred.matrix)

    c <- length(labels)
    pairs <- unlist(lapply(combn(labels, 2, simplify = FALSE), function(x) paste(x, collapse = "/")))

    A.ij.joint <- sum(unlist(A.mean))
    M <- 2 / (c * (c-1)) * A.ij.joint
    attr(M, "pair_AUCs") <- A.mean
    return(M)
}
model <- NaiveBayes(iris.train$Species ~ ., data = iris.train[, -5])
pred <- predict(model, iris.test[,-5], type='raw')
pred.matrix <- pred$posterior
ref.outcome <- iris.test$Species
M <- multiclass.auc(pred.matrix, ref.outcome)
print(paste0("Generalized AUC is: ", round(as.numeric(M), 3)))
## [1] "Generalized AUC is: 0.988"print(attr(M, "pair_AUCs")) # pairwise AUCs## setosa/versicolor setosa/virginica versicolor/virginica
## 1.0000000 1.0000000 0.9627329使用这种方法,广义AUC为0.988 。生成的成对AUC的解释也相似。
摘要
对于多类别问题 。
- 对于硬分类器,您可以使用(加权)准确性以及微观或宏观平均F1分数。
- 对于软分类器,您可以确定一对全精度召回曲线,也可以使用Hand and Till中的AUC 。


