用R中ggplot2包做箱线图、折线图、条形图
用R中ggplot2包做箱线图、折线图、条形图(横、纵)
- 使用ggplot2完成画图工作
- 建议
- 箱线图
- 折线图
- 条形图
- (纵)背景白色+柱子颜色一致
- (纵)条形按y值降序排列+去掉边框线+红色渐变
- (纵)条形按y轴降序排列+显示数值标签+绿色渐变
- (横)条形图+颜色按照分类变量设置
使用ggplot2完成画图工作
下载R软件和RStudio,为了书写方便在RStudio(类似于Matlab)中写代码。
下载ggplot2包:install.packages(“tidyverse”)
加载ggplot2包:library(ggplot2)
建议
先看结果图,再看代码!!!节省时间!!!
箱线图
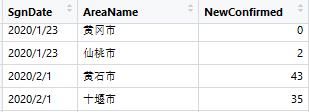
data<- read.csv("D:/abc4.csv", header=T) #header判断导入数据有无表头,T/F
bp <- ggplot(data,aes(x=SgnDate, y=NewConfirmed, fill=SgnDate)) + geom_boxplot()
bp+labs(x="SgnDate",y="NewConfirmed",title="箱线图") #横纵坐标+标题
bp #显示图像
结果:
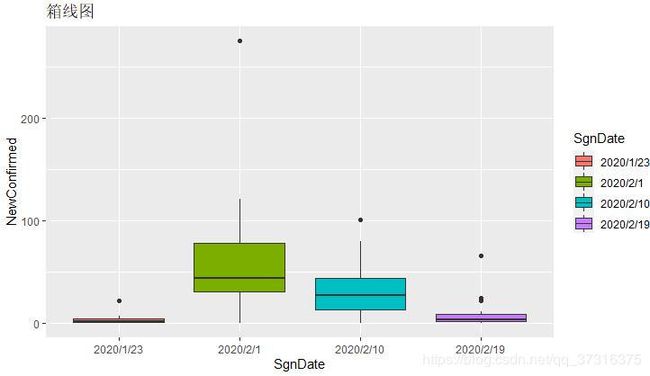 分类变量是SgnDate
分类变量有数值,有level,level是与横坐标标签的顺序和图例的顺序有关系
#更改横坐标标签顺序
data$SgnDate=factor(data$SgnDate,levels=c("2020/1/23","2020/2/1"))
折线图
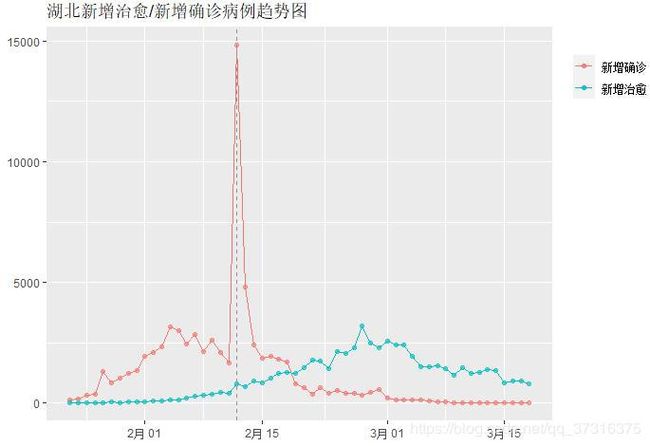
时间序列数据+两条折线+图例+画垂直线段
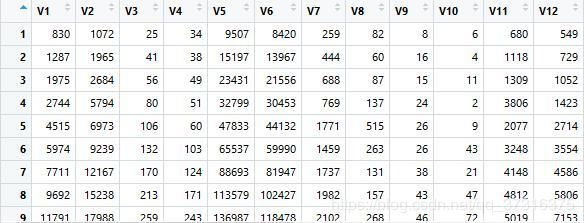
data <-read.csv("D:/CAH.csv", header=F) #导入没有表头的数据
t<-ts(data,frequency=1,start=as.Date("2020/1/23")) #定义data为时间序列数据,按天计算
s<-as.Date("2020/1/23")
date<-seq(from=s,by=1,length.out=56)  #56为时间长度
t<-data.frame(date,t)  #在原数据前面添加了一个时间信息date, 新数据集定义为t
library(ggplot2) #加载ggplot2包
gg<-g+theme(panel.background=element_rect(fill="transparent",color="gray"))
#使背景变为白色,不知道为什么这里设置的颜色gray不起作用
深度解析:
g<-ggplot(t,aes(x=date))+geom_point(aes(y=V19,color="#2ec1e6"),size=1.5,alpha=0.6)
+geom_line(aes(y=V19,color="#2ec1e6"))
+geom_point(aes(y=V22,color="#bcf511"),size=1.5,alpha=0.6)
+geom_line(aes(y=V22,color="#bcf511"))
+geom_vline(aes(xintercept=as.Date("2020-2-12")),colour="#948b8d",linetype="dashed")
geom_point绘制散点,geom_line折线。
geom_vline垂直线段,geom_hline水平线段。
aes(x=?,y=?,col=?,shape=?,group=?)
x和y分别是自变量和因变量,col设置颜色,但是写在aes里面则系统自动按顺序分配颜色,shape设置点的形状,group是按什么分组。aes里面出现col,shape或者group则会自动产生图例。之后可以通过对应函数(scale_colour_discrete、scale_shape_discrete)修改图例标签和题目。颜色若想固定,则放在aes外面。例如:geom_point(aes(y=V19),color="#2ec1e6",size=1.5,alpha=0.6)
条形图
(纵)背景白色+柱子颜色一致
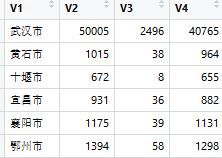
data <- read.csv("D:/bb.csv", header=F)
data$V1 = factor(data$V1, levels=c("咸宁市","十堰市","襄阳市","黄冈市","荆州市","黄石市","宜昌市","孝感市","荆门市","随州市","仙桃市","鄂州市","武汉市")) # 设置柱条的顺序
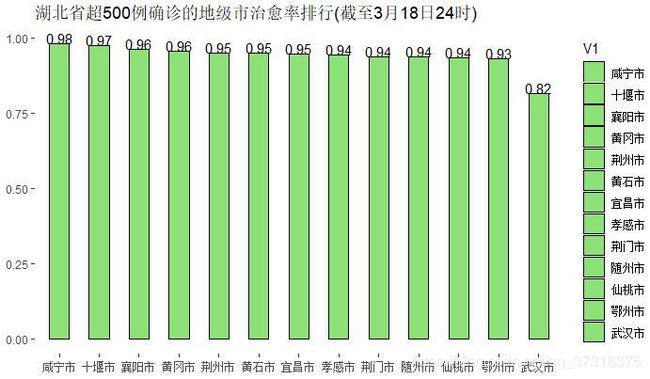
bp<-ggplot(data,mapping=aes(x=V1, y=V4/V2,fill=V1))+geom_bar(stat="identity",position=position_dodge(0.7),width = 0.5, colour="black") +geom_text(aes(label=sprintf("%0.2f",round(V4/V2, digits = 2)), y=V4/V2), position=position_dodge(1),vjust=0)+labs(x="",y="",title="湖北省超500例确诊的地级市治愈率排行(截至3月18日24时)") #条形+显示数值+保留两位小数
bp<-bp+theme(panel.background=element_rect(fill="transparent",color="white")) #修改背景
bp+scale_fill_manual(values=c("#8ee079","#8ee079","#8ee079","#8ee079","#8ee079","#8ee079","#8ee079","#8ee079","#8ee079","#8ee079","#8ee079","#8ee079","#8ee079")) #改条形颜色
bp
(纵)条形按y值降序排列+去掉边框线+红色渐变
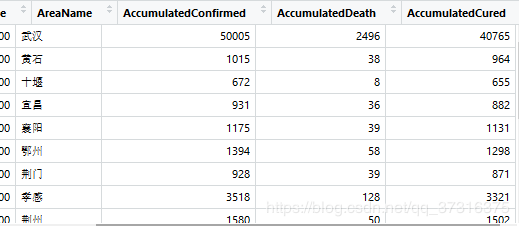
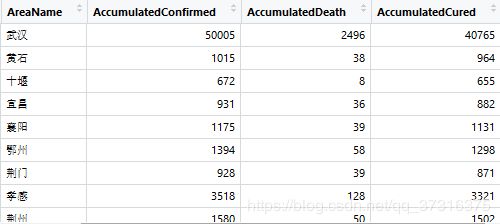
data <- read.csv("D:/3.18hb.csv", header=T) #导入带表头的数据

#这三行代码作用:生成定制的17阶渐变色
cols<-brewer.pal(9,"Reds")
pal<-colorRampPalette(cols)
mycolors<-pal(17)

#将分类变量省份的levels按照病死率升序排列,分类变量由valus和levels两部分组成
x=reorder(data$AreaName, data$AccumulatedDeath/data$AccumulatedConfirmed)
data$AreaName = factor(data$AreaName, levels=levels(x))

#作图,使得条形按照y值降序排列,且无边框
bp<-ggplot(data,mapping=aes(x=reorder(AreaName, -AccumulatedDeath/AccumulatedConfirmed), y=AccumulatedDeath/AccumulatedConfirmed,fill=AreaName))+geom_bar(stat="identity", position=position_dodge(0.1))+labs(x="",y="",title="")
#+geom_text(aes(label=sprintf("%0.3f", round(AccumulatedDeath/AccumulatedConfirmed, digits = 3)), y=AccumulatedDeath/AccumulatedConfirmed+0.001), position=position_dodge(0.9), vjust=0)
bp<-bp+theme(panel.border=element_blank()) #去掉条形的边框线
bp<-bp+guides(fill=FALSE)  #去掉图例
bp<-bp+theme(panel.background = element_blank()) #去掉背景
bp+scale_fill_manual(values=mycolors) #用自己定义的颜色去填充条形,颜色与AreaName的levels对应
结果:

上图为:湖北各地级市病死率排行(截至3月18日24时)
知识点
分类变量有data中的顺序和levels两部分,条形图的顺序是按照levels的顺序排列。若要修改条形图的顺序,可直接通过修改分类变量的levels修改。
> data$AreaName
 [1] 武汉   黄石   十堰   宜昌   襄阳   鄂州   荆门   孝感
 [9] 荆州   黄冈   咸宁   随州   恩施   仙桃   潜江   天门
[17] 神农架
17 Levels: 神农架 十堰 咸宁 恩施 天门 荆州 襄阳 随州 ... 武汉
reorder(x,y)将x按照y值大小进行升序排列
reorder(x,-y)将x按照y值大小进行降序排列
fill=AreaName 按照省份进行填充,因其写在aes内,故系统自动为省份分配颜色
颜色包RColorBrewer的使用方法参见https://www.jianshu.com/p/a8856757a0d2
geom_text可以显示数值标签
geom_text(lable=y1,y=y1+0.05,position=position_dodge(0.9), vjust=0)
y1为纵坐标变量,数值标签相对于条形的位置,可以通过加粗参数自己调节
(纵)条形按y轴降序排列+显示数值标签+绿色渐变
data <- read.csv("D:/3.18hb.csv", header=T)
cols<-brewer.pal(9,"Greens")
pal<-colorRampPalette(cols)
mycolors<-pal(17)
x=reorder(data$AreaName, data$AccumulatedCured/data$AccumulatedConfirmed)
data$AreaName = factor(data$AreaName, levels=levels(x))
bp<-ggplot(data,mapping=aes(x=reorder(AreaName, -AccumulatedCured/AccumulatedConfirmed), y=AccumulatedCured/AccumulatedConfirmed,fill=AreaName))+geom_bar(stat="identity", position=position_dodge(0.1)) +geom_text(aes(label=sprintf("%0.2f", round(AccumulatedCured/AccumulatedConfirmed, digits = 2)), y=AccumulatedCured/AccumulatedConfirmed+0.02), position=position_dodge(0.9), vjust=0)+labs(x="",y="",title="")
bp<-bp+theme(panel.border=element_blank())
bp<-bp+guides(fill=FALSE)
bp<-bp+theme(panel.background = element_blank())
bp+scale_fill_manual(values=mycolors)
结果:
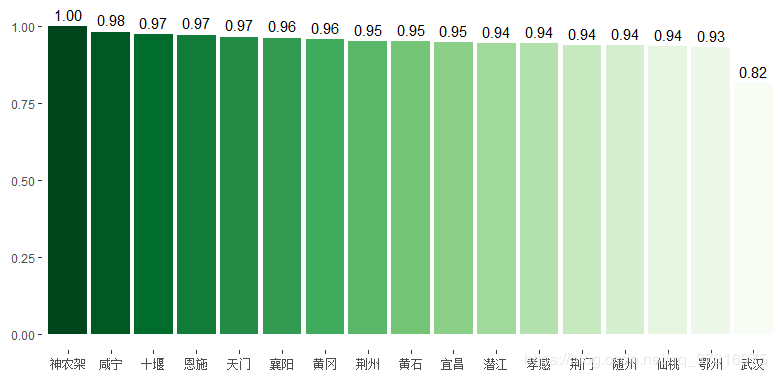
此图为:湖北各地级市治愈率排行(截至3月18日24时)
(横)条形图+颜色按照分类变量设置
为了完成这个功能编了一组数据。
想要实现的功能:横坐标V2,纵坐标为V1的横向条形图,条形的颜色按照V3来标记,即V3数值相同的颜色一致。
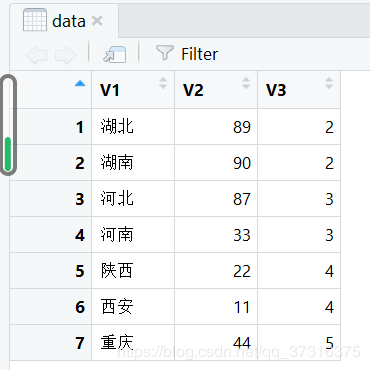
> data <- read.csv("D:/dd.csv", header=F)  #导入不带表头的数据
> library(ggplot2) #加载程序包
> barplot(data$V2,names.arg=data$V1,horiz=T,col=data$V3)  #作图
barpolt中horiz=T即为绘制横条形图,horiz=F即为绘制纵条形图,names.arg为定义分类坐标(当绘制横条形图时为列坐标,绘制纵条形图时为横坐标)。
结果:

这里的颜色是系统默认的配色。要想自定义好看的颜色,可以先将自定义的颜色保存在mycolors变量中,然后将颜色分类变量V3的值与mycolors中的颜色对应起来。
代码:
library(RColorBrewer) #加载颜色配色包,里面的配色基本能满足个人需求
mycolors<-brewer.pal(9,"YlGnBu")  #选取YIGnBu中的9种颜色保存在mycolors中
barplot(data$V2,names.arg=data$V1,horiz=T,col=mycolors[data$V3])  #绘图
结果:
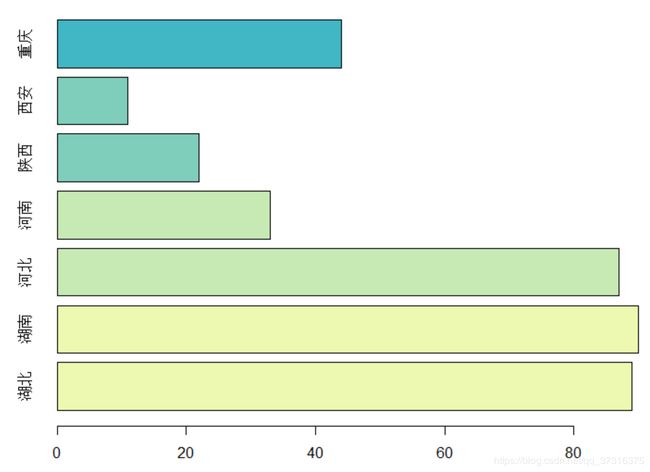
这里再次强调:颜色包RColorBrewer的使用方法参见https://www.jianshu.com/p/a8856757a0d2
里面的配色真的好好看!
