Matplotlib.pyplot绘图讲解
Matplotlib.pyplot绘图讲解
matplotlib是基础绘图包,上手比较简单,本文主要是针对之前已经学过的进行一次温习,后面要转战pycharts,比较粗糙,想看具体的可以参考下面两篇文章:
https://blog.csdn.net/qq_42052864/article/details/81704304
https://blog.csdn.net/qq_34859482/article/details/80617391
导入包
import matplotlib.pyplot as plt
import numpy as np
import matplotlib as mpl
绘图前先码下面三句
mpl.rcParams["font.family"] = "SimHei" # 设置字体
mpl.rcParams["axes.unicode_minus"]=False # 用来正常显示负号
plt.rcParams['font.sans-serif']=['SimHei'] # 用来正常显示中文标签
#嵌入式显示图形
%matplotlib inline
matplotlib绘图基本步骤:
1.准备数据
2.创建图形
3.绘图
4.自定义设置
5.保存
6.展示
创建六种基本图形
plt.rc('figure',figsize=(10,6))
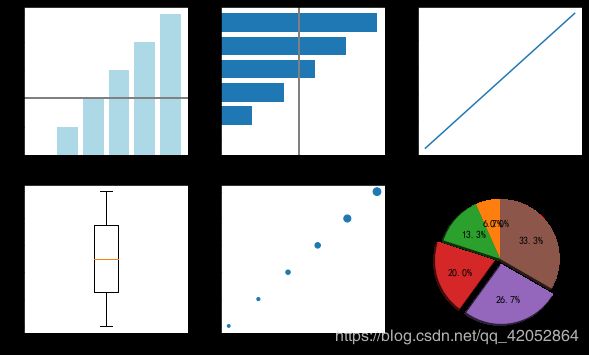
fig,axes=plt.subplots(nrows=2,ncols=3)
#ax0, ax1, ax2, ax3,ax4,ax5 = axes.flatten()
# 也可用 fig=plt.figure(figsize=(6,8)) ax=fig.add_subplot(111)

x=np.arange(6)
y=np.arange(0,12,2)

axes[0,0].bar(x,y,color='lightblue',align='center')
axes[0,0].axhline(4,color='gray',linewidth=2)
axes[0,1].barh(x,y)
axes[0,1].axvline(5,color='gray',linewidth=2)


axes[0,2].plot(x,y)
axes[1,0].boxplot(y,vert=True)#vert 控制箱图方向
axes[1,1].scatter(x,y,s=[8,10,20,30,50,60])
axes[1,2].pie(y,explode=[0,0,0,0.1,0.1,0],labels=x,autopct='%1.1f%%',startangle=90,shadow=True,pctdistance=0.6)
plt.show()
图形如下(比较粗糙哈):

条形图还返回了一个Artists 数组,对应着每个条形vertbars,可通过for循环对条形进行自定义设置;axhline,axvline主要用于图形的参考下用。箱线图可以用vert=False使之横向展示(个人认为横向还是很有用的哦~)
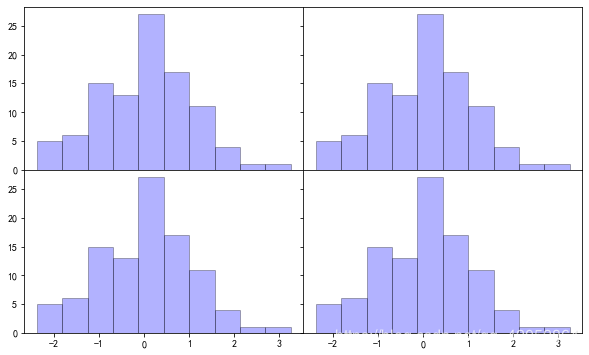
fig,axes=plt.subplots(2,2,sharex=True,sharey=True)
np.random.seed(12345)
data=np.random.randn(100)
for i in range(2):
    for j in range(2):
        axes[i,j].hist(data,bins=10,color='b',edgecolor='k',alpha=0.3)
plt.subplots_adjust(left=None,bottom=None,right=None,top=None,wspace=0,hspace=0)
plt.show()

核密度图目前只知道得用pandas绘图:
series.plot(kind=‘kde’)
或者用seaborn:
seaborn.kdeplot(data,shade=True)
自定义设置
绘图还是有些细节要处理的,布局注释颜色线条标记等,下面是简单的介绍,不过应该够用的了。
线条风格
‘b-’,‘ro’,‘c–’,‘k^’,‘m:’,‘y.’
标记形状 marker
‘.’:点(point marker)
‘,’:像素点(pixel marker)
‘o’:圆形(circle marker)
‘v’:朝下三角形(triangle_down marker)
‘^’:朝上三角形(triangle_up marker)
‘<‘:朝左三角形(triangle_left marker)
‘>’:朝右三角形(triangle_right marker)
‘1’:(tri_down marker)
‘2’:(tri_up marker)
‘3’:(tri_left marker)
‘4’:(tri_right marker)
‘s’:正方形(square marker)
‘p’:五边星(pentagon marker)
‘*’:星型(star marker)
‘h’:1号六角形(hexagon1 marker)
‘H’:2号六角形(hexagon2 marker)
‘+’:+号标记(plus marker)
‘x’:x号标记(x marker)
‘D’:菱形(diamond marker)
‘d’:小型菱形(thin_diamond marker)
‘|’:垂直线形(vline marker)
‘_’:水平线形(hline marker)
打印出来看看
markers = ['.', ',', 'o', 'v', '^', '<', '>', '1', '2', '3', '4', '8', 's', 'p', 'P', '*', 'h', 'H', '+', 'x', 'X', 'D',
           'd', '|', '_']
descriptions = ['point', 'pixel', 'circle', 'triangle_down', 'triangle_up', 'triangle_left', 'triangle_right',
                'tri_down', 'tri_up', 'tri_left', 'tri_right', 'octagon', 'square', 'pentagon', 'plus (filled)', 'star',
                'hexagon1', 'hexagon2', 'plus', 'x', 'x (filled)', 'diamond', 'thin_diamond', 'vline', 'hline']
x = []
y = []
for i in range(5):
    for j in range(5):
        x.append(i)
        y.append(j)
plt.figure()
for i, j, m, l in zip(x, y, markers, descriptions):
    plt.scatter(i, j, marker=m,s=100)
#     plt.text(i - 0.15, j + 0.15, s=m + ' : ' + l)
# plt.axis([-0.1, 4.8, -0.1, 4.5])
plt.tight_layout()
plt.axis('off')
plt.show()
颜色设置
看下面这篇文章,以后我们就不要再当“色盲”了
https://www.cnblogs.com/darkknightzh/p/6117528.html
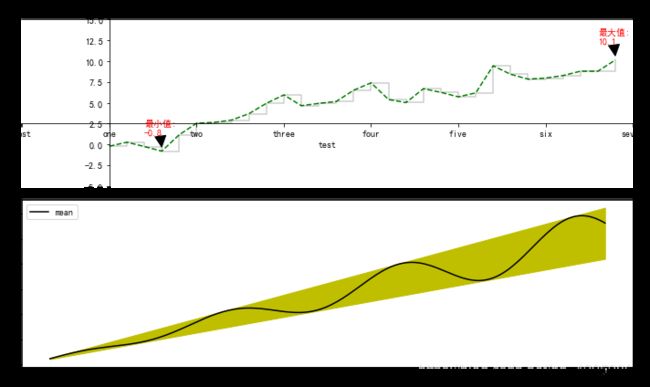
以条形图为例进行一些自定义设置
np.random.seed(12345)
data=np.random.randn(30).cumsum()

fig=plt.figure(figsize=(10,6))
ax1=fig.add_subplot(211)
ax1.plot(data,'g--',label='Default')
ax1.plot(data,'k-',drawstyle='steps-post',label='steps-post',alpha=0.2)
ax1.set_xticks([-5,0,5,10,15,20,25,30])
ax1.set_xticklabels(['test','one','two','three','four','five','six','seven'],rotation=0,fontsize='small')
ax1.set(xlabel='test',title='plot')
ax1.set_xlim(-5,30)
ax1.set_ylim(-5,15)
data0=data.tolist()
values=list([data.max(),data.min()])
labels=['最大值'+":\n"+str(round(values[0],1)),'最小值'+":\n"+str(round(values[1],1))]
for val,label in zip(values,labels):
    ax1.annotate(label, xy=(data0.index(val),val+0.5),#设置箭头坐标位置
                xytext=(data0.index(val)-1,val+2),#设置注释的坐标位置
                arrowprops=dict(facecolor='k'),fontsize=10,color='r')#设置箭头颜色和字体大小

ax1.spines['right'].set_visible(False)
ax1.xaxis.set_ticks_position('bottom')
# ax1.spines['bottom'].set_position(('outward',3))移动下边界离axis 3个距离
# ax1.spines['left'].set_position(('outward',3))
ax1.spines['bottom'].set_position(('data',2.5))#移动左,下边界在(0,2.5)处相交
ax1.spines['left'].set_position(('data',0))

ax2=fig.add_subplot(212)
x=np.linspace(0,10,200)
data_obj={'x':x,
         'y1':2*x+1,
         'y2':3*x+1.2,
         'mean':0.5*x*np.cos(2*x)+2.5*x+1.1}
ax2.fill_between('x','y1','y2',color='y',data=data_obj)#填充两条线之间的颜色
ax2.plot('x','mean',color='k',data=data_obj)

plt.legend(loc='upper left')#labels,loc
plt.tight_layout()
plt.show()

