数据分级的两种方法
-
apply方法
-
cut方法
代码:
import os
import pandas as pd
import matplotlib.pyplot as plt
import numpy as np
plt.rcParams['savefig.dpi'] = 300 #图片像素
plt.rcParams['figure.dpi'] = 300 #分辨率
# 默认的像素:[6.0,4.0],分辨率为100,图片尺寸为 600&400
# 指定dpi=200,图片尺寸为 1200*800
# 指定dpi=300,图片尺寸为 1800*1200
# 设置figsize可以在不改变分辨率情况下改变比例

#首先添加一个level列,然后再看列中怎么分析

outpath = '/Users/miraco/PycharmProjects/DataMining/output3'
filepath = '/Users/miraco/PycharmProjects/DataMining/data_pd/happiness_report.csv'

#获取数据
data_df= pd.read_csv(filepath)

#数据处理
data_df.dropna(inplace = True)
# 先按照年份从小到大排序、同一年份内再按照幸福指数从大到小排序,默认是升序的
data_df.sort_values(['Year', 'Happiness Score'], ascending = [True, False], inplace= True)
print(data_df.head(),'\n--以上是多维排序结果--------------------------') #输出来看看

#数据分析用apply进行分级
# #apply
# def score2level(score):
#     if score <= 3:
#         return 'Low'
#     elif score <= 5:
#         return 'Middle'
#     else:
#         return 'High'
# data_df['Level'] = data_df['Happiness Score'].apply(score2level)

data_df['Level']  = pd.cut(data_df['Happiness Score'],
                           bins = [-np.inf, 3, 5, np.inf],
                           labels=['Low','Middle','High']
                           )

region_year_level_df  = pd.pivot_table(data_df,
                                       index='Region',
                                       columns=['Year','Level'],
                                       values = ['Country'],
                                       aggfunc= 'count')
region_year_level_df.fillna(0,inplace = True)

for year in [2015, 2016,2017]:
    region_year_level_df.to_csv(os.path.join(outpath,'region_year_level.csv'))
    region_year_level_df['Country',year].plot(kind = 'bar',stacked = True, title = year)
    plt.legend(loc=2, bbox_to_anchor=(1.05, 1.0), borderaxespad=0.)  # 这里如果不指定位置,会使图例盖住柱状图
    plt.tight_layout()
    plt.show()
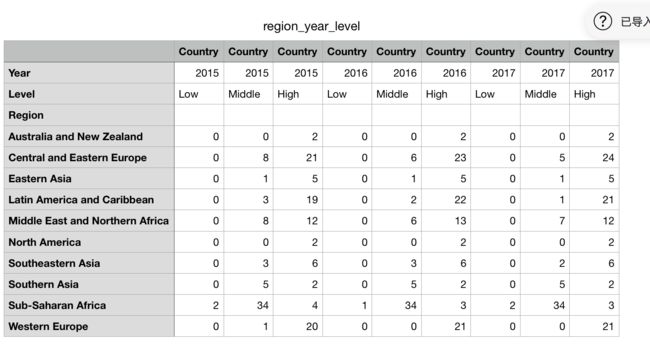
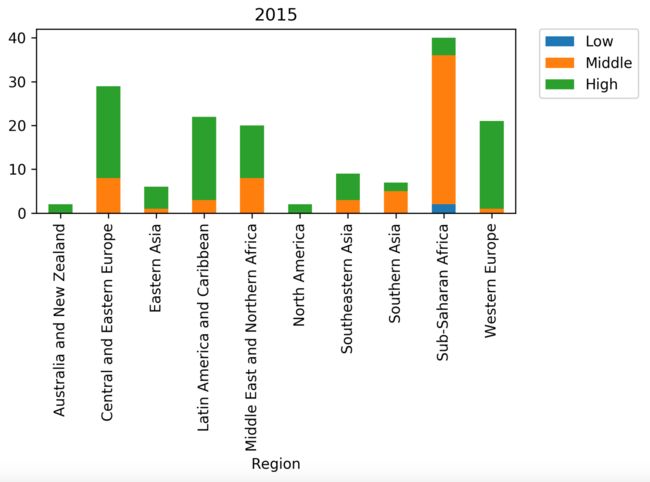
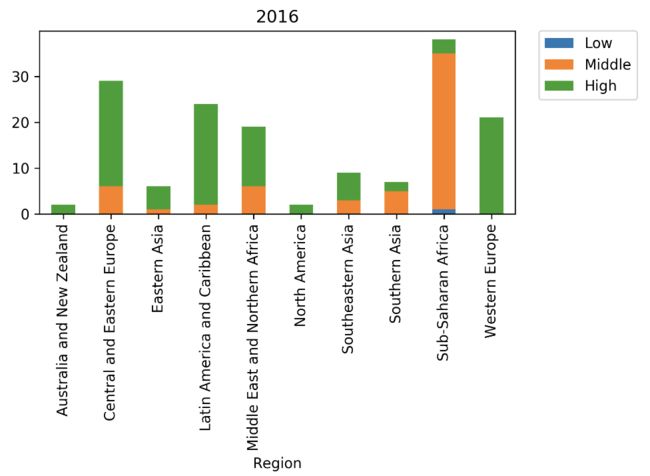
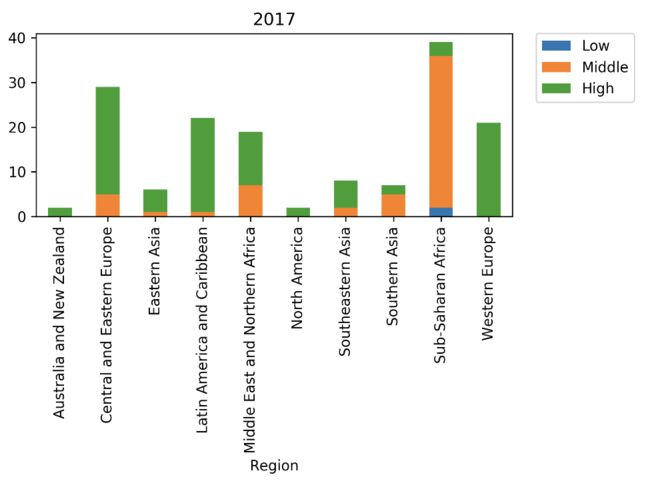
输出内容
需要注意的几个地方
-
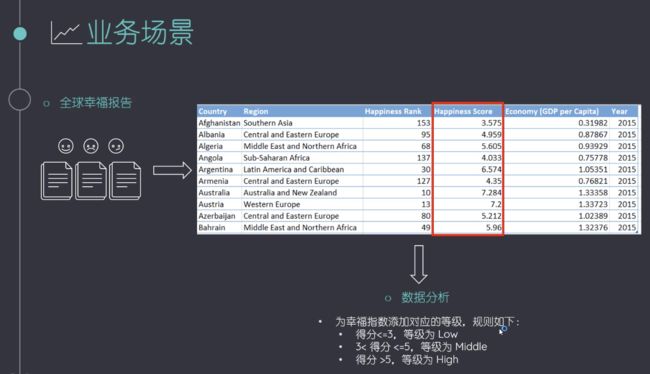
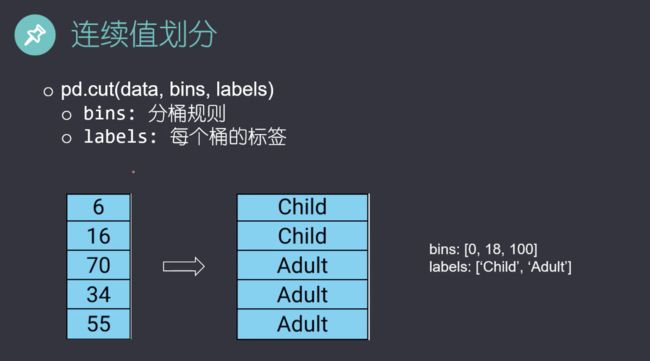
数据分级的时候,可以使用两种办法,一种是.apply(自定义函数),另一种是pd.cut直接对列操作,也输出列。
#数据分析用apply进行分级
#apply
 def score2level(score):
     if score <= 3:
         return 'Low'
     elif score <= 5:
         return 'Middle'
     else:
         return 'High'
 data_df['Level'] = data_df['Happiness Score'].apply(score2level)
data_df['Level']  = pd.cut(data_df['Happiness Score'],
                           bins = [-np.inf, 3, 5, np.inf],
                           labels=['Low','Middle','High']
                           )
- fillna操作:将NA替换成目标值
region_year_level_df.fillna(0,inplace = True) #NA替换成0
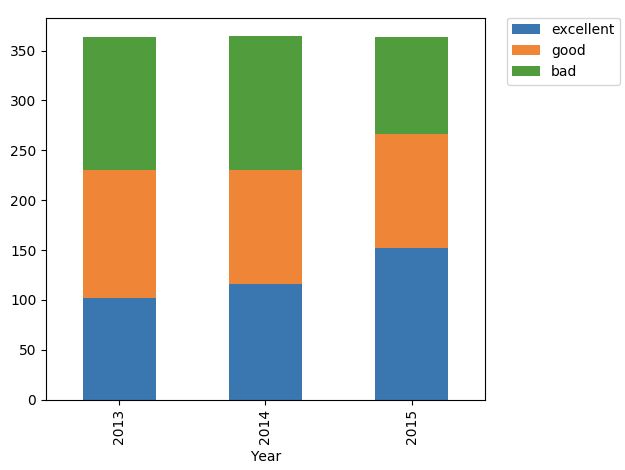
练习:使用堆叠柱状图比较 PM2.5等级
题目描述:根据PM2.5值添加对应的等级,统计每年各等级的占比天数,并使用堆叠柱状图进行可视化。等级规则如下:
0-50: excellent(优)
50-100: good(良)
100-500: bad(污染)
题目要求:
使用Pandas进行数据分析及可视化
数据文件:
数据源下载地址:https://video.mugglecode.com/pm2.csv
pm2.csv,包含了2013-2015年某地区每天的PM2.5值。每行记录为1天的数据。
共4列数据,分别表示:
- Year: 年
- Month: 月
- Day: 日
- PM: PM2.5值
参考代码:
import pandas as pd
import matplotlib.pyplot as plt
import os

outpath = '/Users/miraco/PycharmProjects/DataMining/output3'

if not os.path.exists(outpath):
    os.makedirs(outpath)

filepath = '/Users/miraco/PycharmProjects/DataMining/data_pd/pm2.csv'

#数据获取

data_df = pd.read_csv(filepath).dropna()

#数据处理

data_df['Level'] = pd.cut(data_df['PM'],bins= [0,50,100,500],labels=['excellent','good','bad'])

pivot_results = pd.pivot_table(data_df,
                               index = 'Year',
                               columns= 'Level',
                               values = 'Day',
                               aggfunc = 'count'
               )

pivot_results.to_csv(os.path.join(outpath, 'pivot_results2'))

#
pivot_results.plot(kind = 'bar',stacked = True)
plt.legend(loc=2, bbox_to_anchor=(1.05,1.0),borderaxespad = 0.) #这里如果不指定位置,会使图例盖住柱状图
plt.tight_layout()
plt.show()
