【特征工程】在机器学习中使用地理空间数据(转载)
原文:Working with Geospatial Data in Machine Learning
如何使用地理空间类数据。
首先通过可视化数据集(坐标点)来获得有价值的信息,
然后,提出用于提取和创造新特征的不同方法,这些新特征将优化模型的建立。
数据集来自:New York City Taxi Fare Prediction
由于数据集实在太大,我只使用了测试集。
import numpy as np # linear algebra
import pandas as pd
import matplotlib.pyplot as plt
import seaborn as sns
data = pd.read_csv("C:\\Users\\Nihil\\Documents\\pythonlearn\\data\\kaggle\\spatial.csv")
data.rename(columns={'pickup_longitude':'Pickup Long', 'pickup_latitude':'Pickup Lat'}, inplace = True)
print(data.columns.values)
可视化
可视化的目的:
- 检测、异常值、模式和趋势;
- 在真实情景中考虑数据;
- 了解城市,州或国家/地区之间的数据分布;
- 查看数据的总体外观。
通过可视化,我们决定是否移除数据。
Scatter Plot
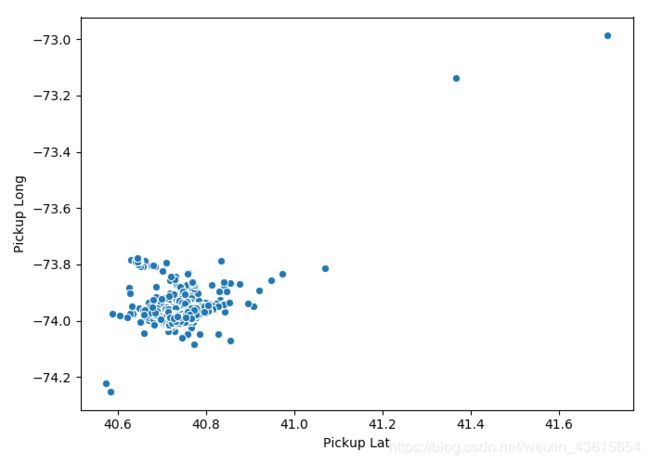
对于地理空间数据,最快的可视化路径是散点图,其基本上显示了这些点之间的关系。
plt.figure(figsize = (7,5))
sns.scatterplot(data['Pickup Lat'], data['Pickup Long'])
plt.show()
Map Plot
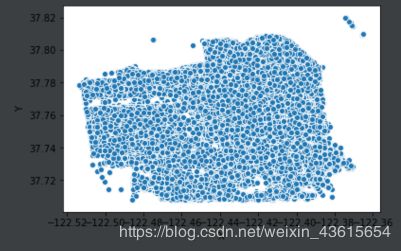
第二种技术是在真实的地图上绘制数据。这是显示坐标和调查数据的一种更明显、更真实的方法。这里引入folium库。
使用folium库的方法:
1.创建一个可以作为数据中心点的位置的地图;
2.将点添加到地图;
3.显示地图。
但我使用失败了,下次再琢磨吧,略过。
import folium
map_pickup = folium.Map(location=[-74.252193,41.709555])
map_pickup.save('map_pickup.html')
Techniques & Ideas
在看到数据是什么样子之后,就该到特性工程阶段了。在这里,我们将提出一些技巧,以提取和构建更好的特征,从而对预测模型进行改进。
1.按原样使用特性(经度,纬度)
即:使用经度和纬度,就像它们目前在预测模型中一样。
但是请记住,这经度和纬度是不同的,你需要使用的模型需要具有”不用标准化“的特性,比如树模型。否则,您必须执行标准化并将它们包含在特性集中。
方法1 四舍五入
- 可以使用不需要任何规范化的模型。
- 取而代之的是,可以将数值四舍五入到小数点后三位或四位,这能对模型的性能作出改善。
train = train.round({'Pickup Long':4,'Pickup Lat':4})
print(train['Pickup Lat'].head())
print(train['Pickup Long'].head())
0    40.7638
1    40.7194
2    40.7513
3    40.7678
4    40.7898
Name: Pickup Lat, dtype: float64
0   -73.9733
1   -73.9869
2   -73.9825
3   -73.9812
4   -73.9660
Name: Pickup Long, dtype: float64
方法2 转化为弧度
另一个简单但功能强大的转换是将纬度和经度转换为弧度。
可以使用NumPy函数radians()来实现。
train['Pickup Long'] = np.radians(train['Pickup Long'])
train['Pickup Lat'] = np.radians(train['Pickup Lat'])
print(train['Pickup Lat'].head())
print(train['Pickup Long'].head())
0    0.711463
1    0.710688
2    0.711244
3    0.711532
4    0.711916
Name: Pickup Lat, dtype: float64
0   -1.291078
1   -1.291315
2   -1.291238
3   -1.291216
4   -1.290950
Name: Pickup Long, dtype: float64
2.Perform Clustering
2.1 坐标点聚类的目的
处理点坐标的方法之一是处理它们之间的关系。
为此,可以采用聚类的方法,给每个聚类ID分配给一个点。
这样,将创建一个分类变量,可以对其进行热编码以获得更好的结果。
2.2 坐标点聚类的算法
聚类算法的选择很重要。
文章的作者测试了许多算法,例如K-means,DBSCAN和Hierarchical clustering。
作者认为,在地理空间要素方面,后两者似乎提供了更好的结果。
当然。这取决于特征空间是否是线性的。如果是线性,可选择K-means。如果是非线性,最好选择后两种。
2.3 clusters的数量
clusters的数量将取决于项目,但是一般来说,必须进行测试,看看什么可以提供更好的结果。
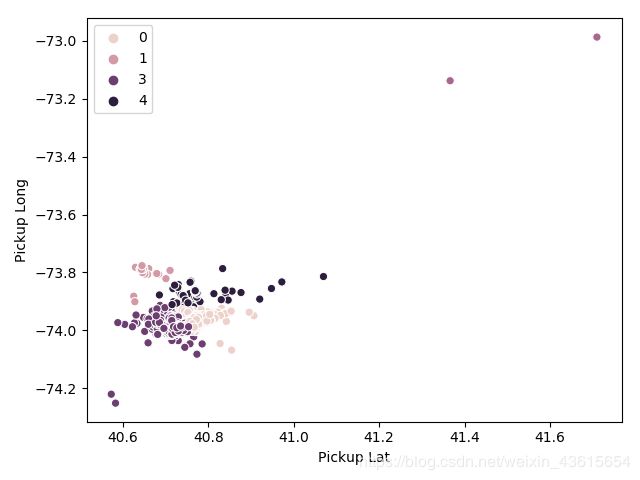
Demo(K-means,5个clusters)
from sklearn.cluster import KMeans,AgglomerativeClustering

agc = AgglomerativeClustering(n_clusters=5,affinity='euclidean', linkage='ward')
train['pickup cluster'] = agc.fit_predict(train[['Pickup Lat','Pickup Long']])
Kmeans = KMeans(5)

clusters = Kmeans.fit_predict(train[['Pickup Lat','Pickup Long']])

sns.scatterplot(train['Pickup Lat'], train['Pickup Long'],hue=clusters)
之前学习的时候还没有开始看K-means,这部分待看。
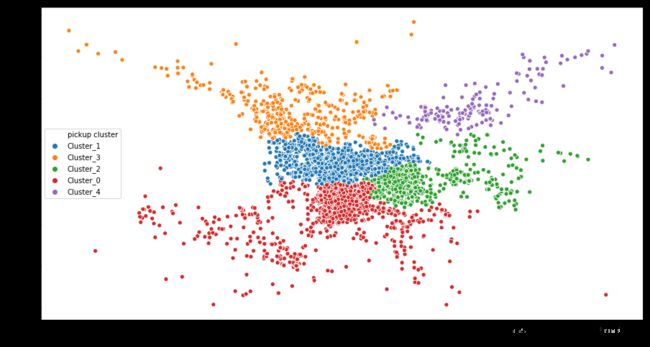
这是原作者画的图。
3.Reverse Geocoding
应用场景:
坐标点之间较为离散(距离较远),并且,数据行包含来自世界不同城市或国家/地区的坐标。
功能:
将点坐标转换为可读的地址或地名(即城市或国家)。这样,我们可以创建一个新的分类变量。
Demo:
from geopy.geocoders import Nominatim

# create the locator
geolocator = Nominatim(timeout=3)

# getting the location address
location = geolocator.reverse("52.509669, 13.376294")
print(location.address)
Backwerk, Potsdamer Platz, Tiergarten, Mitte, Berlin, 10785, Deutschland
GeoPy的官方文档
用本文的例子
from geopy.geocoders import Nominatim

# create the locator
geolocator = Nominatim(timeout=3)

# getting the location address
location = geolocator.reverse("40.7898, -73.9812")
print(location.address)
Riverside Park 6, Riverside Drive, Upper West Side, Manhattan Community Board 7, Manhattan, New York County, New York, 10024, United States of America
NOTE:
location = geolocator.reverse("latitude, longitude")
从整体信息中获取部分信息(街区,邮编等)
from geopy.geocoders import Nominatim

# create the locator
geolocator = Nominatim(timeout=3)

# getting the location address
location = geolocator.reverse("52.509669, 13.376294")

# getting address compontent like street, city, state, country, country code, postalcode and so on.
print('State is {}'.format(location.raw.get('address').get('state')))
print('city_district is {}'.format(location.raw.get('address').get('city_district')))
print('country is {}'.format(location.raw.get('address').get('country')))
print('Postcode is {}'.format(location.raw.get('address').get('postcode')))
State is Berlin
city_district is Mitte
country is Deutschland
Postcode is 10785
由此,我们可以为城市或国家创建一个字段。
注:该方法不适用于只有唯一值的城市变量(只有一个城市时)
4.Distance Feature
4.1所需参数
首先,让我们考虑确定估计到达时间(Estimated Time of Arrival)的问题。为此,数据集将包含出发和目的地坐标。
4.2功能,返回值
通过出发点和目的点的距离计算,可获得一个距离特性。可改善模型。
如果没有两个坐标点,可计算到某一个固定点的举例,这将取决于项目需求。
4.3距离公式
4.3.1 “ Harvsine公式”
demo:
train.rename(columns={'dropoff_longitude':'Destination Long', 'dropoff_latitude':'Destination Lat'}, inplace = True)
def haversine_distance(row):
    lat_p,lon_p = row['Pickup Lat'],row['Pickup Long']
    lat_d,lon_d = row['Destination Lat'],row['Destination Long']
    radius = 6371
    dlat = np.radians(lat_d - lat_p)
    dlon = np.radians(lon_d - lon_p)
    a = np.sin(dlat/2) * np.sin(dlat/2) + np.cos(np.radians(lat_p)) * np.cos(np.radians(lat_d)) * np.sin(dlon/2) * np.sin(dlon/2)
    c = 2 * np.arctan2(np.sqrt(a), np.sqrt(1-a))
    distance = radius * c

    return distance

train['distance'] = train.apply(haversine_distance, axis = 1)
print(train.distance.head())
5.抽取X,Y,Z
可以适度地帮助改善模型,但是可能不如以前的方法有效。
x = cos(lat) * cos(lon)
y = cos(lat) * sin(lon)
z = sin(lat)
DEMO
import numpy as np

train['pickup x'] = np.cos(train['Pickup Lat']) * np.cos(train['Pickup Long'])
train['pickup y'] = np.cos(train['Pickup Lat']) * np.sin(train['Pickup Long'])
train['pickup z'] = np.sin(train['Pickup Lat'])


