使用Jupyter Notebook实现梯度下降法和牛顿法求解多元线性回归问题
牛顿法、梯度下降法原理及Python编程应用
- 一、使用梯度下降法实现求解多元线性回归方程
- 1. 梯度下降法原理
- 2.python实例
- 使用梯度下降法实现求解多元线性回归方程
- 二、使用牛顿迭代法实现求解多元线性回归方程
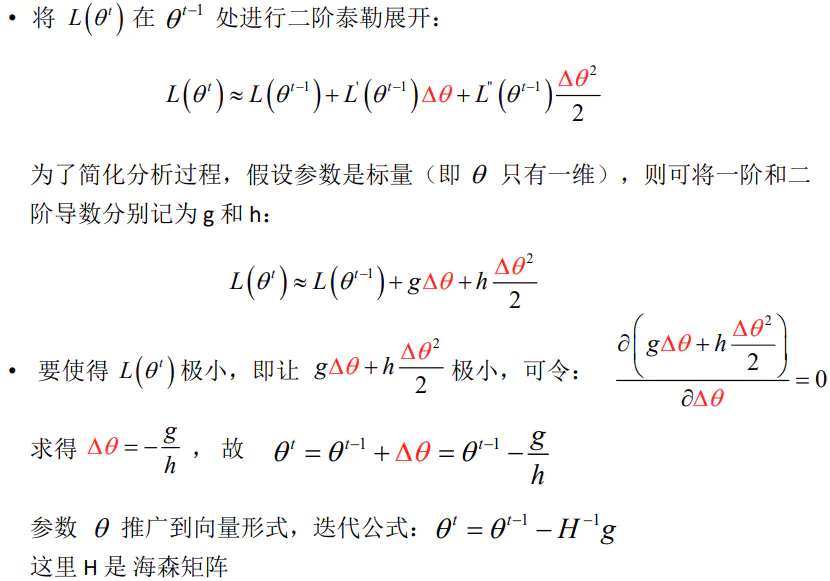
- 1.牛顿迭代法原理
- 2.python实例
- 三、两种方法对比分析
- 1.优缺点对比
- 2.相似度对比
一、使用梯度下降法实现求解多元线性回归方程
1. 梯度下降法原理
梯度下降法应用一阶泰勒展开,假设L(θ)代表损失函数,目标:最小化损失函数,θ是需要更新的模型参数。下面公式中alpha是步长(学习率),可以直接赋值一个小的数,也可以通过line search。

2.python实例
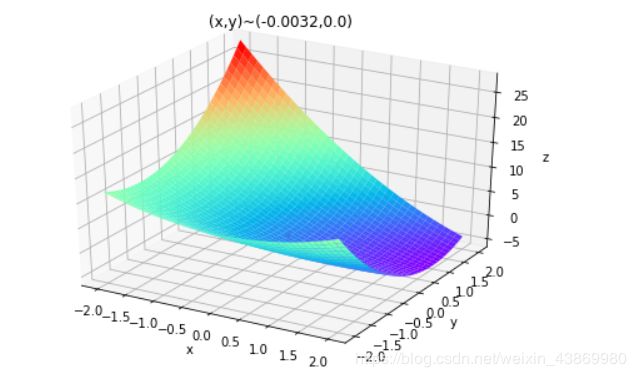
多元函数方程为z=x1 ^2 + 2 * x2 ^2 - 4 * x1- 2 * x1 * x2
使用梯度下降法实现求解多元线性回归方程
import matplotlib.pyplot as plt
from mpl_toolkits.mplot3d import Axes3D
import numpy as np

def Fun(x,y): #原函数
    return x*x+2*y*y+-4*x-2*x*y  #方程为z=x1^2+2x2^2-4x1-2x1x2

def PxFun(x,y): #x偏导
    return 2*x+4-2*y

def PyFun(x,y): #y偏导
    return 4*y-2*x

#初始化
fig = plt.figure() #figure对象
ax = Axes3D(fig) #Axes3D对象
X,Y = np.mgrid[-2:2:40j,-2:2:40j] #取样并作满射联合
Z = Fun(X,Y) #取样点Z坐标打表
ax.plot_surface(X,Y,Z,rstride=1,cstride=1,cmap="rainbow")
ax.set_xlabel('x')
ax.set_ylabel('y')
ax.set_zlabel('z')

#梯度下降
step = 0.0008 #下降系数
x = 0
y = 0 #初始选取一个点
tag_x = [x]
tag_y = [y]
tag_z = [Fun(x,y)] #三个坐标分别打入表中,该表用于绘制点
new_x = x
new_y = y
Over = False
while Over == False:
    new_x -= step*PxFun(x,y)
    new_y -= step*PyFun(x,y) #分别作梯度下降
    if Fun(x,y) - Fun(new_x,new_y) < 7e-9: #精度
        Over = True
    x = new_x
    y = new_y #更新旧点
    tag_x.append(x)
    tag_y.append(y)
    tag_z.append(Fun(x,y)) #新点三个坐标打入表中

#绘制点/输出坐标
ax.plot(tag_x,tag_y,tag_z,'r.')
plt.title('(x,y)~('+str(x)+","+str(y)+')')
plt.show()
二、使用牛顿迭代法实现求解多元线性回归方程
1.牛顿迭代法原理
2.python实例
在这里插入代码片
import numpy as np
from matplotlib import pyplot as plt
from mpl_toolkits.mplot3d import Axes3D
data=np.genfromtxt(r'C:\Users\Sevenssk\Desktop\店铺数据.csv',delimiter=',')
x_data=data[:,:-1]
y_data=data[:,2]
#定义学习率、斜率、截据
#设方程为y=theta1x1+theta2x2+theta0
lr=0.00001
theta0=0
theta1=0
theta2=0
#定义最大迭代次数,因为梯度下降法是在不断迭代更新k与b
epochs=10000
#定义最小二乘法函数-损失函数(代价函数)
def compute_error(theta0,theta1,theta2,x_data,y_data):
    totalerror=0
    for i in range(0,len(x_data)):#定义一共有多少样本点
        totalerror=totalerror+(y_data[i]-(theta1*x_data[i,0]+theta2*x_data[i,1]+theta0))**2
    return totalerror/float(len(x_data))/2
#梯度下降算法求解参数
def gradient_descent_runner(x_data,y_data,theta0,theta1,theta2,lr,epochs):
    m=len(x_data)
    for i in range(epochs):
        theta0_grad=0
        theta1_grad=0
        theta2_grad=0
        for j in range(0,m):
            theta0_grad-=(1/m)*(-(theta1*x_data[j,0]+theta2*x_data[j,1]+theta2)+y_data[j])
            theta1_grad-=(1/m)*x_data[j,0]*(-(theta1*x_data[j,0]+theta2*x_data[j,1]+theta0)+y_data[j])
            theta2_grad-=(1/m)*x_data[j,1]*(-(theta1*x_data[j,0]+theta2*x_data[j,1]+theta0)+y_data[j])
        theta0=theta0-lr*theta0_grad
        theta1=theta1-lr*theta1_grad
        theta2=theta2-lr*theta2_grad
    return theta0,theta1,theta2
#进行迭代求解
theta0,theta1,theta2=gradient_descent_runner(x_data,y_data,theta0,theta1,theta2,lr,epochs)
print('结果:迭代次数:{0} 学习率:{1}之后 a0={2},a1={3},a2={4},代价函数为{5}'.format(epochs,lr,theta0,theta1,theta2,compute_error(theta0,theta1,theta2,x_data,y_data)))
print("多元线性回归方程为:y=",theta1,"X1+",theta2,"X2+",theta0)
#画图
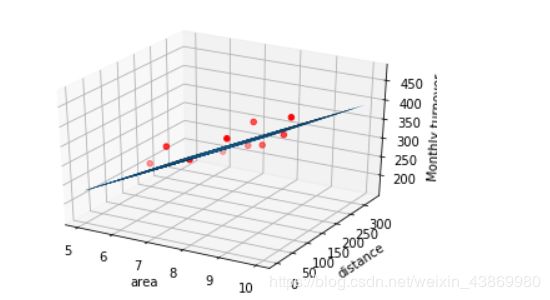
ax=plt.figure().add_subplot(111,projection='3d')
ax.scatter(x_data[:,0],x_data[:,1],y_data,c='r',marker='o')
x0=x_data[:,0]
x1=x_data[:,1]
#生成网格矩阵
x0,x1=np.meshgrid(x0,x1)
z=theta0+theta1*x0+theta2*x1
#画3d图
ax.plot_surface(x0,x1,z)
ax.set_xlabel('area')
ax.set_ylabel('distance')
ax.set_zlabel("Monthly turnover")
plt.show()
三、两种方法对比分析
1.优缺点对比
1.梯度下降法:通过梯度方向和步长,直接求解目标函数最小值时的参数。
越接近最优值时,步长应该不断减小,否则会在最优值附近来回震荡。
2.牛顿法:
优点:通过求解目标函数的一阶导数为0时的参数,进而求出目标函数最小值时的参数。收敛速度很快。海森矩阵的逆在迭代过程中不断减小,可以起到逐步减小步长的效果。
牛顿法:二阶收敛,梯度下降:一阶收敛,所以牛顿法更快。
缺点:海森矩阵的逆计算复杂,代价比较大,因此有了拟牛顿法。
2.相似度对比
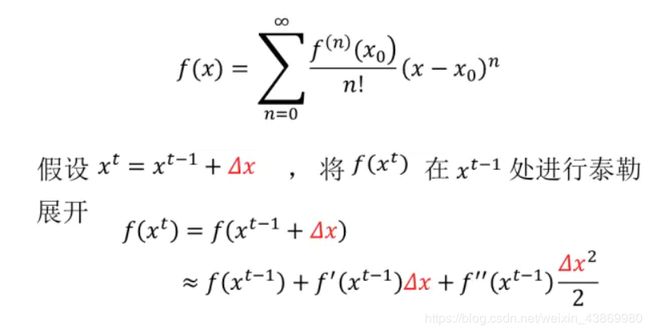
梯度下降和牛顿法的推导均与泰勒公式有关,所以先介绍泰勒展开公式。
基本形式:

上面这个迭代形式将应用到以上的梯度下降和牛顿法中。


