- 《数据结构》学习笔记二:算法(二)
小曼blog
继续上节的学习,我们在这一篇文章里把“算法”这一章内容学习完。本节解决问题:算法的好坏到底是如何评估的?知识点:1.函数的渐进增长2.算法的时间复杂度3.常见的时间复杂度4.算法的空间复杂度1.函数的渐进增长这一知识点与数学相关,不过没关系都是很容易理解的内容。问题:假如两个算法的输入规模都是n,A的执行次数是2n+3,B的执行次数是3n+1,那么这两个算法哪一个更好呢?我们来分析一下,用数学的折
- vue3使用AntV X6 (图可视化引擎)历程[二]
在路上`
Vuevue.jsjavascript
通过h函数动态展示自定义节点内容一、案例效果二、案例代码父组件.BloodTopology.vuerightContentimportRightDrawerfrom'@/common/components/topologyToolKit/RightDrawer.vue';importTopologyCompactfrom'@/common/components/topologyToolKit/To
- 基于 Vue3 + ECharts 实现渐变分段折线图:支持动态区间、响应式渲染与颜色控制
saadiya~
echarts信息可视化前端
在数据可视化项目中,折线图是最常见的图表类型之一,而通过颜色分段渐变可以让用户更加直观地感知数据的变化趋势和区间风险。本文将带你实战一个基于Vue3+ECharts的渐变分段折线图组件,支持传入valueList控制每段颜色,适配多种数据类型,实现图表的动态更新与响应式自适应。一、效果预览与场景说明该组件可应用于以下场景:空气质量指标(AQI)路况拥堵指数(如:0-0.5畅通,0.5-1一般,1-
- 实现一个HTML页面,上传图片后可以测量两条辅助线之间的距离,支持点击添加、拖动和右键删除辅助线
一、项目背景偶尔需要测量图片上元素的宽度高度和间距。因此实现一个交互式、可视化的测距工具。开发一个简单易用的HTML页面,用户可以上传任意图片,在图片上通过点击添加辅助线,拖动调整辅助线位置,右键删除不需要的辅助线,同时自动计算并显示相邻辅助线间的距离,提升效率和准确度。二、核心功能图片上传用户可以上传本地图片作为测距背景,图片会按用户指定的宽高展示,支持任意尺寸,不做限制。辅助线添加用户点击图片
- 【深度学习新浪潮】什么是system 1和system 2?
小米玄戒Andrew
深度学习新浪潮深度学习人工智能大模型推理模型COT模型蒸馏动态推理
在大模型研究中,System1和System2的概念源于心理学家DanielKahneman的双系统理论,用于描述人类思维的两种模式。System1代表快速、直觉、自动化的思维(如模式识别),而System2代表慢速、有意识、需要努力的逻辑推理(如复杂数学计算)。这一理论被引入AI领域后,成为理解大模型能力边界和优化方向的重要框架。一、大模型中的System1与System2的定义System1(
- 基于 vue+Cesium 实现军事标绘之钳击箭头绘制实战
效果图在地理信息系统(GIS)开发中,军事标绘是一个重要的应用场景,其中箭头类标绘(如攻击箭头、钳击箭头)是常用的战术符号。本文将基于Cesium引擎,详细讲解如何实现可交互的钳击箭头绘制功能,支持动态跟随鼠标调整、固定部分标绘区域及自动清理临时标记等特性。一、技术背景与实现目标Cesium简介Cesium是一款开源的3D地理信息引擎,支持高精度全球地形、影像加载及矢量数据可视化,广泛应用于数字地
- java学习笔记
期末课堂作业,以下内容为2024年上学期java课堂学习笔记202402150705目录[第1章:Java语言概述](#第1章:Java语言概述)[第2章:数据类型与运算符](#第2章:数据类型与运算符)[第3章:控制流程语句](#第3章:控制流程语句)[第4章:数组](#第4章:数组)[第5章:类与对象](#第5章:类与对象)[第6章:封装、继承与多态](#第6章:封装、继承与多态)[第7章:异
- 《随园诗话》学习笔记一百五十四
飞鸿雪舞
卷三求诗于书中,得诗于书外八、直抒胸中意【原文】王梦楼侍讲云:“诗称家数,犹之官称衙门也。衙门自以总督为大,典史为小。然以总督衙门之担水夫,比典史衙门之典史,则亦宁为典史,而不为担水夫。何也?典史虽小,尚属朝廷命官;担水夫衙门虽尊,与他无涉。今之学杜、韩不成,而矜矜然自以为大家者,不过总督衙门之担水夫耳。”叶横山先生云:“好摹仿古人者,窃之似,则优孟衣冠;窃之不似,则画虎类狗。与其假人余焰,妄自称
- vue3实现可视化大屏布局
程序猿的杂货店
前端VUE3开发笔记可视化大屏vue3vue3页面布局
实现功能:1实现4x3宫格布局,2自定义设置跨行,跨列自动隐藏对应列,比如setAreaSpanAndUpdateVisibility(2,3,2);表示设置区域2,跨3行,跨2列,然后区域3,6,7,10,11自动隐藏3内容自动剧中1效果图代码数据可视化大屏-顶部区域{{item.id}}-{{item.title}}测试区域1跨2行2列-->importGridCellfrom"./compo
- 用ELK日志分析平台分析常见的系统登录问题
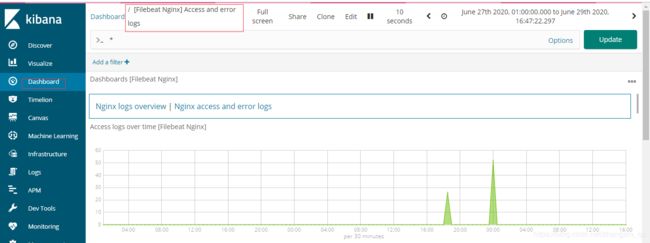
通过ELK(Elasticsearch、Logstash、Kibana)日志分析平台,除了登录超时问题,还可深入分析以下常见的系统登录问题,并结合实际场景提供解决方案:一、认证失败分析1.问题定位场景:用户输入错误密码、账户锁定、服务端认证模块故障等。ELK实现:日志解析:通过Logstash的Grok插件提取关键字段(如用户名、IP、错误类型),例如解析/var/log/auth.log中的Fa
- 【Elasticsearch】IndexService
risc123456
Elasticsearchelasticsearch
一句话:IndexService就是“一个索引在单个节点里的运行时总管”,负责把这个索引在本节点托管的所有分片(主/副)以及它们要用到的资源、配置、线程池、缓存、监听等全部管理起来。---✅IndexService的核心职责(节点维度)模块作用分片生命周期创建/删除/关闭本地IndexShard实例(每个分片一个)。线程池提供`index`,`search`,`refresh`,`flush`,`
- 3篇5章2节:绘制临床研究中的趋势图与ROC曲线
MD分析
用R探索医药数据科学信息可视化r语言r语言-4.2.1数据分析趋势变化图模型性能评估
在医学统计分析与数据科学实践中,趋势图与ROC曲线不仅是可视化的“门面担当”,更是揭示数据背后规律与诊断性能的核心工具。无论是观察血压、血糖等临床指标随时间或干预手段的变化,还是评估模型的判别能力与诊断准确性,一幅设计得当的图表,往往胜过千言万语。本文围绕R语言中两个功能强大的可视化函数展开,深入剖析它们在实际科研中的应用技巧与美化策略。通过案例演示与参数讲解,你将学会如何绘制清晰、美观、信息量丰
- SpringDoc 基本使用指南
墨鸦_Cormorant
#Spring全家桶springspringdoc
SpringDoc是基于SpringBoot的现代化API文档生成工具,通过自动化扫描代码和注解,生成符合OpenAPI3.0+规范的交互式文档,并集成SwaggerUI提供可视化测试界面。以下是其核心详解:核心特性与优势开箱即用仅需添加依赖,无需复杂配置即可自动生成文档,支持SpringWebMvc、WebFlux、SpringSecurity及JakartaEE。注解驱动使用JSR-303规范
- 无需安装的小巧C盘清理工具合集:从一键清理到深度优化,包括更小的.bat文件清理工具
xiaopengbc
软件系统清理垃圾清理文件清理
一、一键清理批处理工具(.bat文件)功能特点双击直接运行,自动扫描并清理C盘系统垃圾文件(如临时文件、缓存等)。无需安装,仅需下载.bat脚本文件即可使用。操作步骤下载文件后双击运行,脚本自动执行清理任务。适用场景适合追求极简操作的用户,尤其对命令行无基础的小白用户。文件下载地址:一键清理批处理工具(.bat文件)二、SpaceSniffer(可视化磁盘分析工具)扫描与空间分析选择分区:启动软件
- 数据呈现进阶:漏斗图与雷达图的实战指南
SickeyLee
信息可视化python数据分析
数据可视化的魅力在于,不同的图表能解锁不同的业务洞察。当你需要分析用户转化路径,或对比多维度性能差异时,基础的柱状图、折线图往往力不从心。本文将聚焦两种进阶图表——漏斗图和雷达图,详解它们的适用场景、分析逻辑和实战案例,帮你掌握“用图表解决复杂问题”的技能。一、漏斗图:追踪转化路径,定位流失“重灾区”漏斗图以“上宽下窄”的形状,直观展示了用户在固定流程中的转化与流失情况。它就像业务流程的“X光片”
- Python Pandas 实践学习笔记(1)
PythonPandas教程Pandas是一个开源的、BSD许可证的Python库,为Python编程语言提供高性能、易于使用的数据结构和数据分析工具。Python与Pandas在学术和商业领域都被广泛应用,包括金融、经济、统计学、分析等领域。在本教程中,我们将学习PythonPandas的各种特性以及如何在实践中使用它们。教程对象本教程适用于那些想要学习Pandas基础知识和各种函数的人。对于从
- 数据可视化——折线图
殇城碎梦.
python基础学习python
#导入所需要的包importmatplotlib.pyplotasplt#设置图表样式plt.style.use('seaborn-v0_8')#增强中文字体配置-添加更多系统字体确保兼容性#增强中文字体配置-优先Windows系统常用字体plt.rcParams["font.family"]=["sans-serif"]plt.rcParams["font.sans-serif"]=["SimH
- 基于Python+Vue的个性化教学可视化系统设计与实现django
源码哆哆*V+ymhydo
毕设pythonvue.jsdjango
文章目录前言系统实现效果前台用户功能模块后台管理功能模块Python技术介绍Django框架介绍预期达到的目标设计思路详细视频演示技术路线解决的思路性能/安全/负载方面可行性分析论证为什么选择我们
- 数据呈现高阶技巧:散点图与桑基图的独特价值
在数据可视化的工具箱中,有些图表看似小众,却能解决特定场景的分析难题。当你需要探索两个变量的关联,或追踪复杂的流量路径时,散点图和桑基图会成为强大的武器。本文将深入解析这两种图表的适用场景、分析逻辑和实战案例,帮你突破传统图表的局限,挖掘更深入的业务洞察。一、散点图:探索变量关系,发现群体特征散点图的核心价值在于展示大样本中两个变量的分布关系。它不像柱状图那样聚焦分类对比,也不像折线图那样追踪时间
- 实时数据可视化的“心跳”设计:毫秒级延迟下的动态图表抗闪烁优化方案
大美工控设计师
信息可视化数据分析数据挖掘
内容摘要在实时数据可视化中,动态图表的抗闪烁优化是一个关键问题。毫秒级的数据更新频率虽然能提供极高的实时性,但也容易导致图表闪烁,严重影响用户体验。这种闪烁不仅让人眼花缭乱,还可能掩盖重要的数据变化。那么,如何在保持毫秒级更新的同时,有效减少图表闪烁呢?本文将深入探讨动态图表抗闪烁的优化方案,从技术原理到实际应用,为你揭示如何打造平滑、流畅的实时数据可视化效果。第一章:实时数据可视化的“心跳”现象
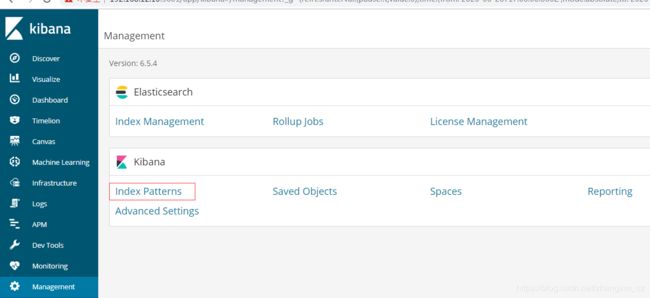
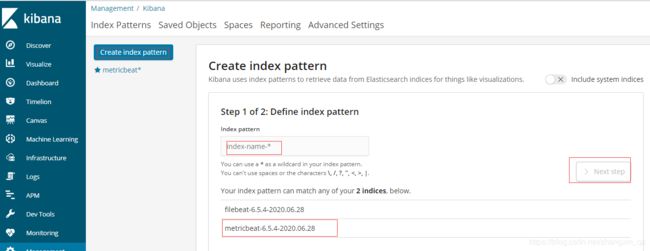
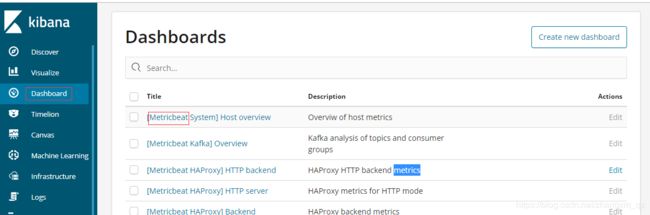
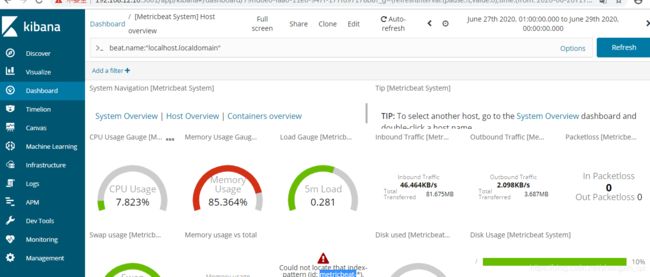
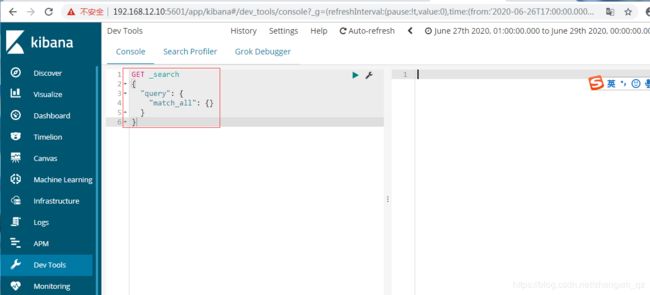
- Docker安装Elasticsearch 7.17.0和Kibana 7.17.0并配置基础安全
1.准备工作确保已安装Docker并启动服务创建必要的目录结构:mkdir-p/opt/es/{config,data,plugins}mkdir-p/opt/kibana/configchmod-R777/opt/es/opt/kibana2.安装Elasticsearch拉取镜像:dockerpullelasticsearch:7.17.0创建配置文件/opt/es/config/elasti
- 关于Ajax的学习笔记
秋也凉
ajax学习笔记
Ajax概念:是一门使用了js语言,可以使用于Javaweb,实现前端代码和后端代码连结的的一种异步同步(不需要等待服务器相应,就能够发送第二次请求)的一种技术,它主要用于网页内容的局部刷新,列如验证码、导航栏的刷新等。实现步骤1.导入jQuery(一种框架,Ajax是JQuery的一种方法)文件——例如:写在jsp页面的标签里面。2.在jsp页面写一个函数,然后在函数里面调用ajax方法,aja
- 吴恩达 机器学习cs229-学习笔记-更新中
是娜个二叉树!
机器学习学习笔记
吴恩达机器学习cs22901基础概念语言:Matlab/python监督学习定义:获取一组数据集拟合数据从X到Y的映射回归问题:预测的Y是连续的,Y是实数分类问题:分类指的是Y取离散值,输出是离散的两组,正示例和负示例,把所有样本推到这条直线上,用0,1,标识逻辑回归算法,拟合直线区分正,负示例处理相对大量特征的回归算法或者分类算法支持向量机算法:它使用的不是1,2,3,10个输入特征,而是使用无
- python学习打卡:DAY 18 推断聚类后簇的类型
西西西仓鼠
python训练营python学习聚类
@浙大疏锦行聚类后的分析:推断簇的类型知识点回顾:推断簇含义的2个思路:先选特征和后选特征通过可视化图形借助ai定义簇的含义科研逻辑闭环:通过精度判断特征工程价值作业:参考示例代码对心脏病数据集采取类似操作,并且评估特征工程后模型效果有无提升。在聚类分析中,推断簇的类型是理解数据内在结构和业务意义的关键步骤。以下是系统化的推断方法及常见簇类型的总结:一、簇的基本类型明显分离的簇特征:不同簇中任意两
- Prometheus搭建 和 Node_Exporter搭建
强_子
prometheus
1.Prometheus和Node_Exporter的关系●Prometheus:是一个开源的监控和告警工具,能够从各种数据源(如NodeExporter)拉取指标,并存储这些指标。它提供了一个强大的查询语言(PromQL),可以用来分析和可视化监控数据。●Node_Exporter:是Prometheus的一个官方插件,用于收集主机系统的硬件和操作系统级别的指标(如CPU使用率、内存使用情况、磁
- Lua学习笔记---多脚本执行和大G表
print("------------------")--全局变量和本地变量fori=1,10doc="123"--全局变量locald=1--本地变量endprint(c)print(d)--多脚本执行print("----------------")require("Test")print(test)print(tetsLoacl)--脚本卸载print("------------------
- 【Grafana】Prometheus指标可视化Grafana,手把手教你如何自定义图形
景天科技苑
grafanaprometheusprometheus可视化grafana自定义图形手撕grafana自定义监控图形
✨✨欢迎大家来到景天科技苑✨✨养成好习惯,先赞后看哦~作者简介:景天科技苑《头衔》:大厂架构师,华为云开发者社区专家博主,阿里云开发者社区专家博主,CSDN全栈领域优质创作者,掘金优秀博主,51CTO博客专家等。《博客》:Python全栈,前后端开发,小程序开发,人工智能,js逆向,App逆向,网络系统安全,数据分析,Django,fastapi,flask等框架,云原生k8s,Prometheu
- 大数据领域数据架构的实时数据可视化架构
AGI大模型与大数据研究院
AI大模型应用开发实战信息可视化大数据架构ai
大数据领域数据架构的实时数据可视化架构关键词:大数据架构、实时数据处理、数据可视化、流式计算、数据管道、可视化工具、性能优化摘要:本文深入探讨了大数据领域中实时数据可视化架构的设计与实现。我们将从基础概念出发,逐步分析实时数据处理流程,介绍关键技术和工具,并通过实际案例展示如何构建高性能的实时可视化系统。文章将涵盖数据采集、处理、存储和可视化展示的全链路架构,同时讨论性能优化策略和未来发展趋势。1
- 《金文成〈中庸〉学习笔记399。2020-2-22》
金吾生
《金文成〈中庸〉学习笔记399。2020-2-22》今天是庚子年戊寅月乙未日,正月廿九,2020年2月22日星期六。【唯天下至诚,为能尽其性;能尽其性,则能尽人之性;能尽人之性,则能尽物之性;能尽物之性,则可以赞天地之化育;可以赞天地之化育,则可以与天地参矣。】上一节,船山讲到诚与性的关系,诚是第二性的,性是第一性的,该怎么理解呢?船山说:“诚者性之撰也,性者诚之所丽也”,意思是说,不能简单地将诚
- 数据库学习笔记——14组合查询
Love零O
本课学习如何利用UNION操作符将多条SELECT语句组合成一个结果集。1组合查询多数SQL查询只包含从一个或多个表中返回数据的单条SELECT语句。但是,SQL也允许执行多个查询(多条SELECT语句),并将结果作为一个查询结果集返回。这些组合查询通常称为并(UNION)或复合查询(compoundquery)。主要有两种情况需要使用组合查询:在一个查询中从不同的表返回结构数据;对一个表执行多个
- 深入浅出Java Annotation(元注解和自定义注解)
Josh_Persistence
Java Annotation元注解自定义注解
一、基本概述
Annontation是Java5开始引入的新特征。中文名称一般叫注解。它提供了一种安全的类似注释的机制,用来将任何的信息或元数据(metadata)与程序元素(类、方法、成员变量等)进行关联。
更通俗的意思是为程序的元素(类、方法、成员变量)加上更直观更明了的说明,这些说明信息是与程序的业务逻辑无关,并且是供指定的工具或
- mysql优化特定类型的查询
annan211
java工作mysql
本节所介绍的查询优化的技巧都是和特定版本相关的,所以对于未来mysql的版本未必适用。
1 优化count查询
对于count这个函数的网上的大部分资料都是错误的或者是理解的都是一知半解的。在做优化之前我们先来看看
真正的count()函数的作用到底是什么。
count()是一个特殊的函数,有两种非常不同的作用,他可以统计某个列值的数量,也可以统计行数。
在统
- MAC下安装多版本JDK和切换几种方式
棋子chessman
jdk
环境:
MAC AIR,OS X 10.10,64位
历史:
过去 Mac 上的 Java 都是由 Apple 自己提供,只支持到 Java 6,并且OS X 10.7 开始系统并不自带(而是可选安装)(原自带的是1.6)。
后来 Apple 加入 OpenJDK 继续支持 Java 6,而 Java 7 将由 Oracle 负责提供。
在终端中输入jav
- javaScript (1)
Array_06
JavaScriptjava浏览器
JavaScript
1、运算符
运算符就是完成操作的一系列符号,它有七类: 赋值运算符(=,+=,-=,*=,/=,%=,<<=,>>=,|=,&=)、算术运算符(+,-,*,/,++,--,%)、比较运算符(>,<,<=,>=,==,===,!=,!==)、逻辑运算符(||,&&,!)、条件运算(?:)、位
- 国内顶级代码分享网站
袁潇含
javajdkoracle.netPHP
现在国内很多开源网站感觉都是为了利益而做的
当然利益是肯定的,否则谁也不会免费的去做网站
&
- Elasticsearch、MongoDB和Hadoop比较
随意而生
mongodbhadoop搜索引擎
IT界在过去几年中出现了一个有趣的现象。很多新的技术出现并立即拥抱了“大数据”。稍微老一点的技术也会将大数据添进自己的特性,避免落大部队太远,我们看到了不同技术之间的边际的模糊化。假如你有诸如Elasticsearch或者Solr这样的搜索引擎,它们存储着JSON文档,MongoDB存着JSON文档,或者一堆JSON文档存放在一个Hadoop集群的HDFS中。你可以使用这三种配
- mac os 系统科研软件总结
张亚雄
mac os
1.1 Microsoft Office for Mac 2011
大客户版,自行搜索。
1.2 Latex (MacTex):
系统环境:https://tug.org/mactex/
&nb
- Maven实战(四)生命周期
AdyZhang
maven
1. 三套生命周期 Maven拥有三套相互独立的生命周期,它们分别为clean,default和site。 每个生命周期包含一些阶段,这些阶段是有顺序的,并且后面的阶段依赖于前面的阶段,用户和Maven最直接的交互方式就是调用这些生命周期阶段。 以clean生命周期为例,它包含的阶段有pre-clean, clean 和 post
- Linux下Jenkins迁移
aijuans
Jenkins
1. 将Jenkins程序目录copy过去 源程序在/export/data/tomcatRoot/ofctest-jenkins.jd.com下面 tar -cvzf jenkins.tar.gz ofctest-jenkins.jd.com &
- request.getInputStream()只能获取一次的问题
ayaoxinchao
requestInputstream
问题:在使用HTTP协议实现应用间接口通信时,服务端读取客户端请求过来的数据,会用到request.getInputStream(),第一次读取的时候可以读取到数据,但是接下来的读取操作都读取不到数据
原因: 1. 一个InputStream对象在被读取完成后,将无法被再次读取,始终返回-1; 2. InputStream并没有实现reset方法(可以重
- 数据库SQL优化大总结之 百万级数据库优化方案
BigBird2012
SQL优化
网上关于SQL优化的教程很多,但是比较杂乱。近日有空整理了一下,写出来跟大家分享一下,其中有错误和不足的地方,还请大家纠正补充。
这篇文章我花费了大量的时间查找资料、修改、排版,希望大家阅读之后,感觉好的话推荐给更多的人,让更多的人看到、纠正以及补充。
1.对查询进行优化,要尽量避免全表扫描,首先应考虑在 where 及 order by 涉及的列上建立索引。
2.应尽量避免在 where
- jsonObject的使用
bijian1013
javajson
在项目中难免会用java处理json格式的数据,因此封装了一个JSONUtil工具类。
JSONUtil.java
package com.bijian.json.study;
import java.util.ArrayList;
import java.util.Date;
import java.util.HashMap;
- [Zookeeper学习笔记之六]Zookeeper源代码分析之Zookeeper.WatchRegistration
bit1129
zookeeper
Zookeeper类是Zookeeper提供给用户访问Zookeeper service的主要API,它包含了如下几个内部类
首先分析它的内部类,从WatchRegistration开始,为指定的znode path注册一个Watcher,
/**
* Register a watcher for a particular p
- 【Scala十三】Scala核心七:部分应用函数
bit1129
scala
何为部分应用函数?
Partially applied function: A function that’s used in an expression and that misses some of its arguments.For instance, if function f has type Int => Int => Int, then f and f(1) are p
- Tomcat Error listenerStart 终极大法
ronin47
tomcat
Tomcat报的错太含糊了,什么错都没报出来,只提示了Error listenerStart。为了调试,我们要获得更详细的日志。可以在WEB-INF/classes目录下新建一个文件叫logging.properties,内容如下
Java代码
handlers = org.apache.juli.FileHandler, java.util.logging.ConsoleHa
- 不用加减符号实现加减法
BrokenDreams
实现
今天有群友发了一个问题,要求不用加减符号(包括负号)来实现加减法。
分析一下,先看最简单的情况,假设1+1,按二进制算的话结果是10,可以看到从右往左的第一位变为0,第二位由于进位变为1。
- 读《研磨设计模式》-代码笔记-状态模式-State
bylijinnan
java设计模式
声明: 本文只为方便我个人查阅和理解,详细的分析以及源代码请移步 原作者的博客http://chjavach.iteye.com/
/*
当一个对象的内在状态改变时允许改变其行为,这个对象看起来像是改变了其类
状态模式主要解决的是当控制一个对象状态的条件表达式过于复杂时的情况
把状态的判断逻辑转移到表示不同状态的一系列类中,可以把复杂的判断逻辑简化
如果在
- CUDA程序block和thread超出硬件允许值时的异常
cherishLC
CUDA
调用CUDA的核函数时指定block 和 thread大小,该大小可以是dim3类型的(三维数组),只用一维时可以是usigned int型的。
以下程序验证了当block或thread大小超出硬件允许值时会产生异常!!!GPU根本不会执行运算!!!
所以验证结果的正确性很重要!!!
在VS中创建CUDA项目会有一个模板,里面有更详细的状态验证。
以下程序在K5000GPU上跑的。
- 诡异的超长时间GC问题定位
chenchao051
jvmcmsGChbaseswap
HBase的GC策略采用PawNew+CMS, 这是大众化的配置,ParNew经常会出现停顿时间特别长的情况,有时候甚至长到令人发指的地步,例如请看如下日志:
2012-10-17T05:54:54.293+0800: 739594.224: [GC 739606.508: [ParNew: 996800K->110720K(996800K), 178.8826900 secs] 3700
- maven环境快速搭建
daizj
安装mavne环境配置
一 下载maven
安装maven之前,要先安装jdk及配置JAVA_HOME环境变量。这个安装和配置java环境不用多说。
maven下载地址:http://maven.apache.org/download.html,目前最新的是这个apache-maven-3.2.5-bin.zip,然后解压在任意位置,最好地址中不要带中文字符,这个做java 的都知道,地址中出现中文会出现很多
- PHP网站安全,避免PHP网站受到攻击的方法
dcj3sjt126com
PHP
对于PHP网站安全主要存在这样几种攻击方式:1、命令注入(Command Injection)2、eval注入(Eval Injection)3、客户端脚本攻击(Script Insertion)4、跨网站脚本攻击(Cross Site Scripting, XSS)5、SQL注入攻击(SQL injection)6、跨网站请求伪造攻击(Cross Site Request Forgerie
- yii中给CGridView设置默认的排序根据时间倒序的方法
dcj3sjt126com
GridView
public function searchWithRelated() {
$criteria = new CDbCriteria;
$criteria->together = true; //without th
- Java集合对象和数组对象的转换
dyy_gusi
java集合
在开发中,我们经常需要将集合对象(List,Set)转换为数组对象,或者将数组对象转换为集合对象。Java提供了相互转换的工具,但是我们使用的时候需要注意,不能乱用滥用。
1、数组对象转换为集合对象
最暴力的方式是new一个集合对象,然后遍历数组,依次将数组中的元素放入到新的集合中,但是这样做显然过
- nginx同一主机部署多个应用
geeksun
nginx
近日有一需求,需要在一台主机上用nginx部署2个php应用,分别是wordpress和wiki,探索了半天,终于部署好了,下面把过程记录下来。
1. 在nginx下创建vhosts目录,用以放置vhost文件。
mkdir vhosts
2. 修改nginx.conf的配置, 在http节点增加下面内容设置,用来包含vhosts里的配置文件
#
- ubuntu添加admin权限的用户账号
hongtoushizi
ubuntuuseradd
ubuntu创建账号的方式通常用到两种:useradd 和adduser . 本人尝试了useradd方法,步骤如下:
1:useradd
使用useradd时,如果后面不加任何参数的话,如:sudo useradd sysadm 创建出来的用户将是默认的三无用户:无home directory ,无密码,无系统shell。
顾应该如下操作:
- 第五章 常用Lua开发库2-JSON库、编码转换、字符串处理
jinnianshilongnian
nginxlua
JSON库
在进行数据传输时JSON格式目前应用广泛,因此从Lua对象与JSON字符串之间相互转换是一个非常常见的功能;目前Lua也有几个JSON库,本人用过cjson、dkjson。其中cjson的语法严格(比如unicode \u0020\u7eaf),要求符合规范否则会解析失败(如\u002),而dkjson相对宽松,当然也可以通过修改cjson的源码来完成
- Spring定时器配置的两种实现方式OpenSymphony Quartz和java Timer详解
yaerfeng1989
timerquartz定时器
原创整理不易,转载请注明出处:Spring定时器配置的两种实现方式OpenSymphony Quartz和java Timer详解
代码下载地址:http://www.zuidaima.com/share/1772648445103104.htm
有两种流行Spring定时器配置:Java的Timer类和OpenSymphony的Quartz。
1.Java Timer定时
首先继承jav
- Linux下df与du两个命令的差别?
pda158
linux
一、df显示文件系统的使用情况,与du比較,就是更全盘化。 最经常使用的就是 df -T,显示文件系统的使用情况并显示文件系统的类型。 举比例如以下: [root@localhost ~]# df -T Filesystem Type &n
- [转]SQLite的工具类 ---- 通过反射把Cursor封装到VO对象
ctfzh
VOandroidsqlite反射Cursor
在写DAO层时,觉得从Cursor里一个一个的取出字段值再装到VO(值对象)里太麻烦了,就写了一个工具类,用到了反射,可以把查询记录的值装到对应的VO里,也可以生成该VO的List。
使用时需要注意:
考虑到Android的性能问题,VO没有使用Setter和Getter,而是直接用public的属性。
表中的字段名需要和VO的属性名一样,要是不一样就得在查询的SQL中
- 该学习笔记用到的Employee表
vipbooks
oraclesql工作
这是我在学习Oracle是用到的Employee表,在该笔记中用到的就是这张表,大家可以用它来学习和练习。
drop table Employee;
-- 员工信息表
create table Employee(
-- 员工编号
EmpNo number(3) primary key,
-- 姓