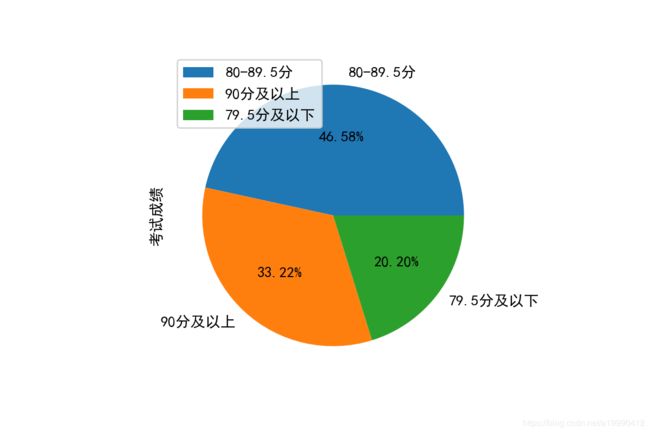
Python高效画饼图
简述
帮助朋友来做一个画饼图的任务,给了一系列数据,然后画出饼图。
理论上来讲应该是很快速的,而且这个任务也很简单。
但是存在一些小的坑,总是需要我查找以前的做的东西,慢慢填上,耗费了一点时间。
这点时间上的耗费,让我觉得甚至不如直接用excel画个图。
为了解决这个时间上的消耗问题,这里我将这些坑都整理了一下,让以后调用的时候更加方便。
代码
import matplotlib.pyplot as plt
def pie(data, index_map=None, Chinese=False, autopct="%.2f%%", legend=False, legend_loc=None, save_name=None, dpi=None):
    data = data.value_counts()

    # 标签是否映射
    if index_map:
        data.index = data.index.map(index_map)

    # 是否存在中文
    if Chinese:
        plt.rcParams['font.sans-serif']=['SimHei']  # 用来正常显示中文标签
        plt.rcParams['axes.unicode_minus']=False  # 用来正常显示负号

    # 是否显示饼内文字
    if autopct:
        data.plot.pie(autopct=autopct)
    else:
        data.plot.pie()

    # 是否显示悬浮框
    if legend:
        # 是否设定位置
        if legend_loc:
            plt.legend(loc=legend_loc)
        else:
            plt.legend()

    # 是否保存
    if save_name:
        if not dpi:
            dpi=100
        plt.savefig(save_name, dpi=dpi)
调用实例
df.iloc[:, 1] 表示选取dataframe的第一列的数据,作为输入。
这个数据就是一系列的标签,比如label1,label2等等之类的。
而我使用的这个数据的这一列内容是,数字1,2,3等等。
所以,我才需要添加一个新的index_map来映射到日常中用到的具体标签,而不是某个某个抽象的数字。
当然,如果之前的这一列已经就是我们想要的标签的话,就直接使用就好了。
参数描述
- index_map:一个index的映射函数。
- Chinese:是否用到了中文
- legend:是否有悬浮框
- legend_loc:悬浮框的位置
- save_name:图片保存的名字 or 路径
- dpi:图片精度
d = ['90分及以上','80-89.5分','79.5分及以下']
pie(df.iloc[:, 1], index_map=lambda x: d[int(x-1)], Chinese=True, legend=True, legend_loc="upper left", save_name="test.png", dpi=200)

legend_loc还有其他的属性:'upper right', 'upper left', 'lower left', 'lower right', 'right', 'center left', 'center right', 'lower center', 'upper center', 'center', 'best'