心脏病预测案例
背景
心脏病是人类健康的头号杀手。全世界1/3的人口死亡是心脏病引起的。而我国,每年有几十万人死于心脏病。如果可以通过提取人体相关的体测指标,通过数据挖掘方式来分析不同特征对于心脏病的影响,将对预防心脏病起到至关重要的作用。本文提供真实的数据,并通过阿里云机器学习平台搭建心脏病预测案例。
数据集介绍
数据源为UCI开源数据集heart_disease。包含了303条美国某区域的心脏病检查患者的体测数据。具体字段如下表。
由于很多人问源数据,我再贴一遍出来:http://archive.ics.uci.edu/ml/machine-learning-databases/00000/
该链接下有个 heart.txt 的文本,数据源全是纯数字,我做过变更才出现下面贴的数据。
age 用年数表示的年龄 sex- 性别枚举(1 = 男性; 0 = 女性)
cp: 胸部疼痛的类型 (值为 ‘1’: 典型的心绞痛 值为 ‘2’: 非典型的心绞痛 值为 ‘3’: 非心绞痛的疼痛)
trestbpss: 静息血压 (准许入院的毫米汞柱(mm Hg))
chol: 以mg/dl为单位的血清类固醇
fbs: (空腹血糖 > 120 mg/dl) (1 = 是; 0 = 否)
restecg: 静息心电图结果 (值为 0: 正常 值为 1: 有ST-T波异常 (T波倒置和/或ST段抬高或压低>0.05 mV) 值为 2: 显示该标准下可能或明确的的左心室肥厚)
thalach : 达到的最大心率
exang : 是否运动诱发的心绞痛 (1 = 是; 0 = 否)
oldpeak : 由与相对休息有明显差异的运动诱导的ST段压低
slope : 运动高峰期的ST段斜率 (值为 1: 上斜 值为 2: 水平)
ca : 被透视荧光检查(flourosopy)标注颜色的大血管的数量 (0-3)
thal : 3 = 正常; 6 = 固有缺陷; 7 = 可修复缺陷
num : 心脏病的诊断 (冠状动脉疾病状态)
status:值为 0: < 50% 直径缩小 (意味着’没有疾病’) 值为 1: > 50% 直径缩小 (意味着’出现了疾病’)
先导入数据:
import pandas as pd
import numpy as np
import matplotlib.pyplot as plt
import warnings
warnings.filterwarnings('ignore')
%matplotlib inline
data = pd.read_table('F:\\data_load\\heat_dieses.txt', sep=' ',names = ['age','sex','cp','trestbps','chol','fbs','restecg','thalach',\
'exang','oldpeak','slop','ca','thal','status','style'])
data.head()
data['ca'].value_counts()0.0 175
1.0 65
2.0 38
3.0 20
? 5
Name: ca, dtype: int64经过分析发现有字段出现异常值,经过分析将异常值用字段的众数填充:
for j in range(0,data.shape[0]):
    if data['ca'][j] == '?':
        data['ca'][j] = data['ca'].mode()[0]
由于style只是患病的类型,与预测结果无关,可以去掉
data = data.drop(['style'],axis=1)上图中很多数据都是文字描述的,在数据预处理的过程中需要根据每个字段的含义将字符转为数值。
二值类的数据:
比如sex字段有female和male两种形式,可以将female表示成0,male表示成1。
多值类的数据:
比如cp字段,表示胸部的疼痛感,可以将疼痛感由轻到重映射成0~3的数值。
cp_mapping = {'angina':0,'abnang':2,'notang':1,'asympt':3}
data['cp'] = data['cp'].map(cp_mapping)

sex_mapping = {'fem':0,'male':1}
data['sex'] = data['sex'].map(sex_mapping)

fbs_mapping = {'true':0,'fal':1}
data['fbs'] = data['fbs'].map(fbs_mapping)

restecg_mapping = {'hyp':2,'norm':0,'abn':'1'}
data['restecg'] = data['restecg'].map(restecg_mapping)

exang_mapping = {'true':0,'fal':1}
data['exang'] = data['exang'].map(exang_mapping)

slop_mapping = {'down':2,'flat':1,'up':0}
data['slop'] = data['slop'].map(slop_mapping)

thal_mapping = {'rev':2,'fix':1,'norm':0,'?':0}
data['thal'] = data['thal'].map(thal_mapping)

status_mapping = {'sick':1,'buff':0}
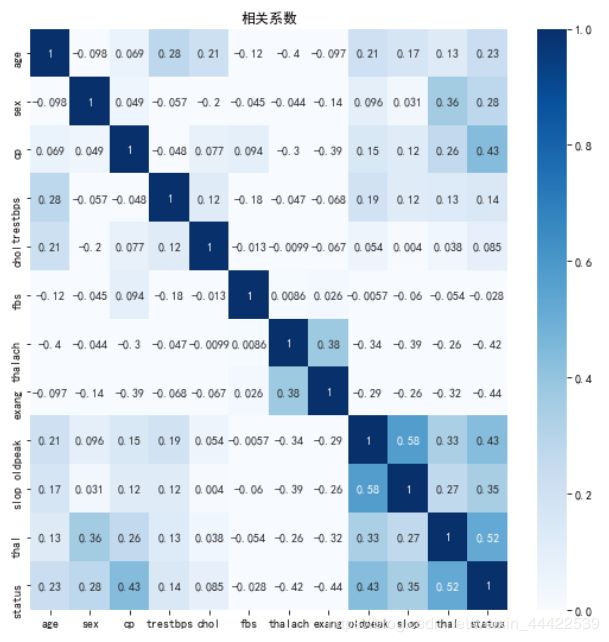
data['status'] = data['status'].map(status_mapping)data.head()接下来看一下每个特征的相关系数:
corr = data.corr()
import seaborn as sns
fig, ax = plt.subplots(figsize=(9,9))
ax.set_title(u'相关系数')
sns.heatmap(corr,annot=True,vmax=1,vmin=0,xticklabels=True,yticklabels=True,cmap=plt.cm.Blues);
归一化
将每个特征的数值范围变为0到1之间,可以去除量纲对结果的影响,公式为result=(val-min)/(max-min)。本次实验通过逻辑回归二分类来进行模型训练,需要每个特征去除量纲的影响。归一化结果如下图所示。
from sklearn.preprocessing import StandardScaler
Scaler = StandardScaler()
for column in data.columns:
    if column != 'status':
        data[column] = Scaler.fit_transform(data[column].values.reshape(-1,1))
监督学习就是已知结果来训练模型。因为已经知道每个样本是否患有心脏病,因此本次实验是监督学习。解决的问题是预测一组用户是否患有心脏病。
-
拆分
通过拆分组件将数据分为两部分,本次实验按照训练集和预测集7:3的比例拆分。训练集数据流入逻辑回归二分类组件用来训练模型,预测集数据进入预测组件。 -
逻辑回归二分类
逻辑回归是一个线性模型,通过计算结果的阈值实现分类(具体的算法详情请自行查阅资料)。逻辑回归训练好的模型可以在模型页签中查看。
接下来对模型进行交叉验证,选出合适的超参数:
def print_KFold_scores(x_train_data, y_train_data):
    fold = KFold(5,shuffle=False)

    c_param_range = [0.01,0.1,1,10,100]

    result_table = pd.DataFrame(index = range(len(c_param_range),2), columns = ['C_parameter','Mean recall score'])
    result_table['C_parameter'] = c_param_range

    j = 0
    recall_accs = []
    for c_param in c_param_range:
        print('----------------------------')
        print('c_param',c_param)
        print('----------------------------')

        for train_index, test_index in fold.split(x_train_data):
            lr = LogisticRegression(C = c_param, penalty = 'l2')
            lr.fit(x_train_data.iloc[train_index,:],y_train_data.iloc[train_index,:].values.ravel())
            y_pred = lr.predict(x_train_data.iloc[test_index,:])

            recall_acc = recall_score(y_train_data.iloc[test_index,:].values.ravel(),y_pred,average="micro")
            recall_accs.append(recall_acc)

            print('recall_score',recall_acc)

        result_table.loc[j,1:2] = np.mean(recall_accs)
        j+=1
        print('Mean recall score:',np.mean(recall_accs))
    best_c = result_table.loc[result_table['Mean recall score'].astype('float').idxmax()]['C_parameter']
    print('*****************************************************************************')
    print('Best model to choose from cross validation is with C parameter = ', best_c)
    print('*****************************************************************************')
    return best_c

best_c = print_KFold_scores(X_train,y_train)
----------------------------
c_param 0.01
----------------------------
recall_score 0.7551020408163265
recall_score 0.8979591836734694
recall_score 0.7916666666666666
recall_score 0.875
recall_score 0.8541666666666666
Mean recall score: 0.8347789115646258
----------------------------
c_param 0.1
----------------------------
recall_score 0.7142857142857143
recall_score 0.8775510204081632
recall_score 0.8125
recall_score 0.8541666666666666
recall_score 0.8541666666666666
Mean recall score: 0.8286564625850341
----------------------------
c_param 1
----------------------------
recall_score 0.7142857142857143
recall_score 0.8775510204081632
recall_score 0.8333333333333334
recall_score 0.8333333333333334
recall_score 0.8333333333333334
Mean recall score: 0.8252267573696146
----------------------------
c_param 10
----------------------------
recall_score 0.7142857142857143
recall_score 0.8775510204081632
recall_score 0.8333333333333334
recall_score 0.8541666666666666
recall_score 0.8333333333333334
Mean recall score: 0.8245535714285713
----------------------------
c_param 100
----------------------------
recall_score 0.7142857142857143
recall_score 0.8775510204081632
recall_score 0.8333333333333334
recall_score 0.8541666666666666
recall_score 0.8333333333333334
Mean recall score: 0.8241496598639455
*****************************************************************************
Best model to choose from cross validation is with C parameter =  0.01
*****************************************************************************
画出混淆矩阵图:
def plot_confusion_matrix(cm, classes,
                          title='Confusion matrix',
                          cmap=plt.cm.Blues):
    """
    This function prints and plots the confusion matrix.
    """
    plt.imshow(cm, interpolation='nearest', cmap=cmap)
    plt.title(title)
    plt.colorbar()
    tick_marks = np.arange(len(classes))
    plt.xticks(tick_marks, classes, rotation=0)
    plt.yticks(tick_marks, classes)

    thresh = cm.max() / 2.
    for i, j in itertools.product(range(cm.shape[0]), range(cm.shape[1])):
        plt.text(j, i, cm[i, j],
                 horizontalalignment="center",
                 color="white" if cm[i, j] > thresh else "black")

    plt.tight_layout()
    plt.ylabel('True label')
    plt.xlabel('Predicted label')
import itertools
lr = LogisticRegression(C=0.01,penalty = 'l2')
lr.fit(X_train,y_train)
y_pred = lr.predict(X_test.values)
# Compute confusion matrix
cnf_matrix = confusion_matrix(y_test,y_pred)
np.set_printoptions(precision=2)
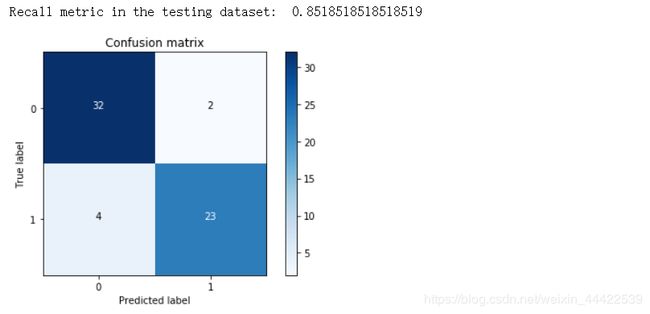
print("Recall metric in the testing dataset: ", cnf_matrix[1,1]/(cnf_matrix[1,0]+cnf_matrix[1,1]))
# Plot non-normalized confusion matrix
class_names = [0,1]
plt.figure()
plot_confusion_matrix(cnf_matrix
, classes=class_names
, title='Confusion matrix')
plt.show()
lr.score(X_test,y_test)0.9016393442622951由上可知:模型的数据的分类准确率为:0.9016393442622951,召回率为:0.8518518518519
由混淆矩阵图可知仅仅将两个正常人误判为患病者,效果符合实际要求。


