Python高级--Pandas读写数据与表格
一、使用Pandas读取数据
1、使用read_csv和read_table读取
1)pd.read_csv(filepath_or_buffer,sep=’,’ ,header=’infer’)
'''
sep: 制定哪个符号作为分割符(默认是 “ ,”)
'''
一)直接读取数据
pd.read_csv('./data/type_comma')
    a   b   c   d   message
0   1   2   3   4   hello
1   5   6   7   8   world
2   9   10  11  12  python
二)指定分隔符读取数据
df1 = pd.read_csv('./data/type_line',sep='-')
    你好  我好  他也好
0   也许  大概  有可能
1   然而  未必  不见得
这样读取的数据没有行名自动加上,默认使用第一行数据作为列明
三)如果第一行不是列明,是内容,可以设置header=None
df1 = pd.read_csv('./data/type_line',sep='-',header=None)
    0     1     2
0   你好  我好  他也好
1   也许  大概  有可能
2   然而  未必  不见得
四)pd.read_csv()还可以读取其他类型的文件,只是要定义分隔符
pd.read_csv('./data/wheats.tsv',sep='\t',header=None)
    0       1       2       3       4       5       6       7
0   15.26   14.84   0.8710  5.763   3.312   2.2210  5.220   Kama
1   14.88   14.57   0.8811  5.554   3.333   1.0180  4.956   Kama
。。。
207 13.20   13.66   0.8883  5.236   3.232   8.3150  5.056   Canadian
208 11.84   13.21   0.8521  5.175   2.836   3.5980  5.044   Canadian
209 12.30   13.34   0.8684  5.243   2.974   5.6370  5.063   Canadian
210 rows × 8 columns
2)pd.read_table(filepath_or_buffer,sep=’\t’,float_precision=None)
功能:用来读取table separated value tsv文件,该文件是是用 \t 分割的一系列值
一)直接读取数据
pd.read_table('./data/wheats.tsv')
    15.26   14.84   0.871   5.763   3.312   2.221   5.22    Kama
0   14.88   14.57   0.8811  5.554   3.333   1.0180  4.956   Kama
1   14.29   14.09   0.9050  5.291   3.337   2.6990  4.825   Kama
。。。
207 11.84   13.21   0.8521  5.175   2.836   3.5980  5.044   Canadian
208 12.30   13.34   0.8684  5.243   2.974   5.6370  5.063   Canadian
209 rows × 8 columns
二)列明默认是数据内容,使用header=None将其修改
pd.read_table('./data/wheats.tsv',header=None)
    0       1       2       3       4       5       6       7
0   15.26   14.84   0.8710  5.763   3.312   2.2210  5.220   Kama
1   14.88   14.57   0.8811  5.554   3.333   1.0180  4.956   Kama
。。。
207 13.20   13.66   0.8883  5.236   3.232   8.3150  5.056   Canadian
208 11.84   13.21   0.8521  5.175   2.836   3.5980  5.044   Canadian
209 12.30   13.34   0.8684  5.243   2.974   5.6370  5.063   Canadian
210 rows × 8 columns
三)read_table也可以读其他类型的文件 只不过要指定分隔符
pd.read_table('./data/type_comma',sep=',')
    a   b   c   d   message
0   1   2   3   4   hello
1   5   6   7   8   world
2   9   10  11  12  python
二、使用Pandas读写excel
可能需要安装库
conda install openpyxl
conda install xlsxwriter
conda install xlrd
1、读取excel表格
df2 = pd.read_excel('./data/jfeng.xlsx')
df2
    0   1   2   3   4
0   26  81  38  73  68
1   1   68  64  65  79
2   7   13  92  19  61
3   53  79  31  45  46
4   56  8   56  75  54
2、excel表格写入文件DateFrame.to_excel(“文件路径”)
功能:将DataFrame写入excel表格
注意:写入时用DataFrame对象调用df.to_excel()
sheet_name='Sheet1'  默认是表1

df.to_excel('./jf.xlsx')
三、读取sqlite文件
1)连接数据库
connection = sqlite3.connect('./data/weather_2012.sqlite')
connection
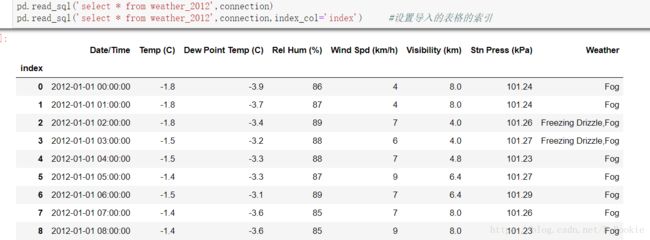
2)读取table内容 pd
查询数据库内容–输入Sql语句
#查询数据库表中的数据,并设置索引,默认自动创建索引
pd.read_sql('select * from weather_2012',connection)
3)写入数据库文件
df对象.to_sql(‘要新建的表名’ , 连接的数据库对象)
df2.to_sql('text',connection)4)删除数据库中的表
connection.execute(‘drop table jfeng’) # drop table 要删除的表格名
connection.execute('drop table text') 四、使用read_csv直接读取网络上的数据
url = https://raw.githubusercontent.com/datasets/investor-flow-of-funds-us/master/data/weekly.csv
过去网页上面的数据
url = ‘https://raw.githubusercontent.com/datasets/investor-flow-of-funds-us/master/data/weekly.csv’
pd.read_csv(url)
五、透视表
各种电子表格程序和其他数据分析软件中一种常见的数据汇总工具。它根据一个或多个键对数据进行聚合,并根据行和列上的分组键将数据分配到各个矩形区域中
创建一个表数据
data = np.random.randint(60,100,size=(6,2))
columns = ['height','weight']
df = DataFrame(data=data,columns=columns)
df['age'] = [20,18,30,26,22,32]
df['smoke'] = [True,False,True,False,False,False]
df['sex'] = ['male','female','male','male','female','female']
df

  height    weight  age smoke   sex
0     78      82    20  True    male
1     80      73    18  False   female
2     66      88    30  True    male
3     97      86    26  False   male
4     70      88    22  False   female
5     67      64    32  False   female
求男性的平均年龄 和 女性的平均年龄
1)使用groupby分组求平均结果
df.groupby('sex').groups     #先将性别进行分组
df.groupby('sex')['age'].mean()  #对年龄求平均值
df.groupby('sex')[['age','height','smoke','weight']].mean()  #对各列进行求平均值

        age         height      smoke       weight
sex
female  24.000000   72.333333   0.000000    75.000000
male    25.333333   80.333333   0.666667    85.333333
2)使用pd.pivot_table()进行
pd.pivot_table(data,values=None,index=None,columns=None,aggfunc=’mean’,fill_value=None,margins=False,dropna=True,margins_name=’All’)
'''
data:要查看的数据
index:以哪个列作为筛选条件
aggfunc:聚合方式
'''pd.pivot_table(df,index='sex')
age height smoke weight
sex
female 24.000000 86.666667 0.000000 87.666667
male 25.333333 88.666667 0.666667 79.000000sex female male
age 24.000000 25.333333
height 86.666667 88.666667
smoke 0.000000 0.666667
weight 87.666667 79.000000六、交叉表
pd.crosstab(index,colums)
是一种用于计算分组频率的特殊透视图,对数据进行汇总
# 男性和女性 吸烟和不吸烟 的人数
pd.crosstab(index=df.sex,columns=df.smoke)

  smoke False   True
sex
female   3      0
male     1      2

pd.crosstab(index=df.smoke,columns=df.sex)

  sex   female  male
smoke
False     3      1
True      0      2
