tf.keras
tf.keras是tensorflow的高级api,可以快速搭建神经模型
六步法搭建神经网络:
import
train_data / test_data
model=tf.keras.models.Sequential
model.compile
model.fit
model.summary
说明:
tf.keras.models.Sequential([网络结构])
网络结构举例(从输入层到输出层的网络结构):
    1) 拉直层 tf.keras.layers.Flatten()
    2) 全连接层 tf.keras.layers.Dense(神经元个数, activation="激活函数", kernel_regualarizer=正则方法)
        activation 可选 : relu、softmax、 sigmoid、 tanh
                    relu激活函数 y=max(0,x) ,输入x,返回x与0的最大值
                    softmax 将向量转换成概率分布. x=[x1,x2,x3] 转换后 y=[e^x1/sum, e^x2/sum, e^x3/sum], sum=e^x1 + e^x2 + e^x3
        kernel_regularizer可选: tf.keras.regularizers.l1()、tf.keras.regularizers.l2()
    3) 卷积层 tf.keras.layers.Conv2D(filters=卷积核个数, kernel_size=卷积核尺寸, strides=卷积步长, padding="valid"或"same")
    4) LSTM层(循环神经网络层) tf.keras.layers.LSTM()
model.compile(optimizer=优化器, loss=损失函数, metrics=["正确率"])
Optimizer可选:
    1) sgd or tf.keras.optimizers.SGD(lr=学习率,momentum=动量参数)
    2) adagrade or tf.keras.optimizers.Adagrad(lr=学习率)
    3) adadelta or tf.keras.optimizers.Adadelta(lr=学习率)
    4) adam or tf.keras.optimizers.Adam(lr=学习率, beta_1=0.9, beta_2=0.999)

loss可选:
    1) mse or tf.keras.losses.MeanSquaredError()
    2) sparse_categorical_crossentropy or tf.keras.losses.SparseCategoricalCrossentropy(from_logits=False)  #当标签y_是顺序编码(不是向量)时Loss采用该损失函数计算交叉熵;如果输出经过概率分布该值为False,否则为True
    3) categorical_crossentropy #当标签y_ 是one-hot编码的向量时,使用该损失函数计算softmax的交叉熵
    4) binary_crossentropy  #二元的交叉熵函数;它是二分类的损失函数(一般计算sigmoid的交叉熵)

Metrics可选:
    1) accuracy  标签y_ 和输出y 都是数值(非向量)时使用
    2) categorical_accuracy  标签y_和 输出y都是独热码的向量时使用
    3) sparse_categorical_accuracy  标签y_ 是数值, 而输出y 是独热码的向量时使用
model.fit(训练集的输入特征, 训练集的标签, batch_size= , epochs= , validation_data=(测试集的输入特征, 测试集的标签), validation_split=从训练集划分多少比例给测试集, validation_freq=多少次epoch测试一次)
model.summary() 输出网络结构和参数统计
例1、 预测鸢尾花分类
鸢尾花的数据集样例如下:
[[6.1 2.8 4.  1.3]
 [6.3 3.3 4.7 1.6]
 [6.8 2.8 4.8 1.4]
 [5.3 3.7 1.5 0.2]
 [5.4 3.4 1.7 0.2]
 ...... ]
神经网络如下:
import tensorflow as tf
import numpy as np
from sklearn import datasets

x_train = datasets.load_iris().data
y_train = datasets.load_iris().target

np.random.seed(116)
np.random.shuffle(x_train)
np.random.seed(116)
np.random.shuffle(y_train)
tf.random.set_seed(116)

model = tf.keras.models.Sequential([
    tf.keras.layers.Dense(3, activation='softmax', kernel_regularizer=tf.keras.regularizers.l2())
])
#3个神经元; 由于本例是多分类预测,所以激活函数为softmax;使用正则化l2缓解过拟合.

model.compile(optimizer=tf.keras.optimizers.SGD(lr=0.1),
              loss=tf.keras.losses.SparseCategoricalCrossentropy(from_logits=False),
              metrics=['sparse_categorical_accuracy']
              )
#优化器选用SGD; 由于标签y_ 是索引值(非独热码的向量),所以损失函数使用SparseCategoricalCrossentropy,来计算softmax的交叉熵;由于输出为概率分布,并非原始值,所以from_logits为False;

model.fit(x_train, y_train, batch_size=32, epochs=500, validation_split=0.2, validation_freq=20)
#每32组为一批放入模型; 训练500次; 20%的数据用于训练集; 每20个验证一次训练集

model.summary()
可以使用class类封装一个神经网络结构, 代码风格如下:
import tensorflow as tf
import numpy as np
from sklearn import datasets

x_train = datasets.load_iris().data
y_train = datasets.load_iris().target

np.random.seed(116)
np.random.shuffle(x_train)
np.random.seed(116)
np.random.shuffle(y_train)
tf.random.set_seed(116)

class IrisMode(tf.keras.Model):
    def __init__(self):
        super(IrisMode, self).__init__()
        #定义网络结构块
        self.d1 = tf.keras.layers.Dense(3, activation='softmax', kernel_regularizer=tf.keras.regularizers.l2())

    def call(self, x):
        y = self.d1(x)  #调用网络结构块,实现前向传播
        return y

model = IrisMode()

model.compile(optimizer=tf.keras.optimizers.SGD(lr=0.1),
              loss=tf.keras.losses.SparseCategoricalCrossentropy(from_logits=False),
              metrics=['sparse_categorical_accuracy']
              )

model.fit(x_train, y_train, batch_size=32, epochs=500, validation_split=0.2, validation_freq=20)

model.summary()
例2、 mnist数据集的模型训练
MNIST是使用手写数字的数据集,该数据集包含60,000个用于训练的示例和10,000个用于测试的示例。这些数字已经通过尺寸标准化并位于图像中心,图像是固定大小(28x28像素),其值为0到1。为简单起见,每个图像都被平展并转换为784(28 * 28)个特征的一维numpy数组。注: 在使用前需要下载mnist.npz文件,并放置~/.keras/datasets/ 目录。
import tensorflow as tf
mnist = tf.keras.datasets.mnist
(x_train, y_train), (x_test, y_test) = mnist.load_data()
x_train, x_test = x_train / 255.0, x_test / 255.0

model = tf.keras.models.Sequential([
    tf.keras.layers.Flatten(),
    tf.keras.layers.Dense(128, activation='relu'),
    tf.keras.layers.Dense(10, activation='softmax')
])
model.compile(optimizer='adam', loss=tf.keras.losses.SparseCategoricalCrossentropy(from_logits=False), metrics=['sparse_categorical_accuracy'])
# 标准标签是y_ 是数值,而输出是softmax概率分布,所以metrics选择sparse_categorical_accuracy
model.fit(x_train, y_train, batch_size=32, epochs=5, validation_data=(x_test, y_test), validation_freq=1)
model.summary()
使用class封装神经网络对MNIST进行训练,风格如下:
import tensorflow as tf
mnist = tf.keras.datasets.mnist
(x_train, y_train), (x_test, y_test) = mnist.load_data()
x_train, x_test = x_train / 255.0, x_test / 255.0

class MnistModel(tf.keras.Model):
    def __init__(self):
        super(MnistModel, self).__init__()
        self.flatten = tf.keras.layers.Flatten()
        self.dense1 = tf.keras.layers.Dense(128, activation='relu')
        self.dense2 = tf.keras.layers.Dense(10, activation='softmax')

    def call(self, x):
        x = self.flatten(x)
        x = self.dense1(x)
        y = self.dense2(x)
        return y

model = MnistModel()

model.compile(optimizer='adam', loss=tf.keras.losses.SparseCategoricalCrossentropy(from_logits=False), metrics=['sparse_categorical_accuracy'])
model.fit(x_train, y_train, batch_size=32, epochs=5, validation_data=(x_test, y_test), validation_freq=1)
model.summary()
例3、fastion_mnist 数据集的模型训练
fashion 数据集 提供6W张2828像素点的衣裤等图片和标签用于训练;提供1W张2828像素点的图片用于测试;一共有10个类别, 标签在0-9之间,代表着衣服的类型 (['t-shirt', 'trouser', 'pullover', 'dress', 'coat', 'sandal', 'shirt', 'sneaker', 'bag', 'ankle boot'])。图像是一个28*28的像素数组,每个像素的值为0~255之间的8位无符号整数(uint8),使用三维NDArray存储,最后一维表示通道个数。由于为灰度图像,故通道数为1。注: 使用时需要下载 t10k-images-idx3-ubyte.gz t10k-labels-idx1-ubyte.gz train-images-idx3-ubyte.gz train-labels-idx1-ubyte.gz文件,并放置 ~/.keras/datasets/fashion-mnist/ 目录 。
T-shirt/top(T恤)/Trouser(裤子)/Pullover(套头衫)/Dress(连衣裙)/Coat(外套)/Sandal(凉鞋)/Shirt(衬衫)/Sneaker(运动鞋)/Bag(包)/Ankle boot(靴子)
样例展示如下:
import tensorflow as tf
from matplotlib import pyplot as plt
fashion = tf.keras.datasets.fashion_mnist
(x_train, y_train), (x_test, y_test) = fashion.load_data()
class_names = ['T-shirt/top', 'Trouser', 'Pullover', 'Dress', 'Coat', 'Sandal', 'Shirt', 'Sneaker', 'Bag', 'Ankle boot']

plt.figure(figsize=(10, 2))
for i in range(5):
    plt.subplot(1, 5, i+1)
    plt.xticks([])
    plt.yticks([])
    plt.grid('off')
    plt.imshow(x_train[i])
    plt.xlabel(class_names[y_train[i]])
plt.show()
执行结果如下:
将训练图片归一化,并显示灰白图,代码如下所示:
import tensorflow as tf
from matplotlib import pyplot as plt
fashion = tf.keras.datasets.fashion_mnist
(x_train, y_train), (x_test, y_test) = fashion.load_data()
class_names = ['T-shirt/top', 'Trouser', 'Pullover', 'Dress', 'Coat', 'Sandal', 'Shirt', 'Sneaker', 'Bag', 'Ankle boot']

x_train = x_train / 255.0   #归一化
print(x_train[0])
plt.figure(figsize=(10, 2))
for i in range(5):
    plt.subplot(1, 5, i+1)
    plt.xticks([])
    plt.yticks([])
    plt.grid('off')
    plt.imshow(x_train[i],cmap=plt.cm.binary)  #cmap定义图谱, 默认RGB,此处表示灰白图,也可以直接引用"binary"
    plt.xlabel(class_names[y_train[i]])
plt.show()
执行结果如下:
fastion-mnist数据集模型训练,代码如下:
import tensorflow as tf
import numpy as np
from matplotlib import pyplot as plt

fashion = tf.keras.datasets.fashion_mnist
(x_train, y_train), (x_test, y_test) = fashion.load_data()
x_train, x_test = x_train / 255.0, x_test / 255.0

model = tf.keras.Sequential([
    tf.keras.layers.Flatten(input_shape=(28, 28)),
    tf.keras.layers.Dense(128, activation='relu'),
    tf.keras.layers.Dense(10)
])
#Flatten层将image转换格式,将(28*28 pixels)二维数组转换成(28*28=784 pixels)的一维数组,可以把这个层看作是将图像中的像素行分解并排列起来.这一层没有需要学习的参数;它只会重新格式化数据
#Dense为全连接层,第一个Dense层有128个神经元;第二个Dense层返回长度为10的logits数组(因为图像有10个分类)

model.compile(optimizer='adam',
              loss=tf.keras.losses.SparseCategoricalCrossentropy(from_logits=True),
              metrics=['accuracy'])
#优化器选择adam; 由于标签y_ 是顺序码,所以使用SparseCategoricalCrossentropy损失函数; 由于最后一层没有指定激活函数,所以输出为原始值;由于输出y和标签y_都是顺序码,所以metrics使用accuracy;

model.fit(x_train, y_train, epochs=10)
test_loss, test_acc = model.evaluate(x_test, y_test, verbose=2) #使用模型在测试集上评估损失和正确率(测试集的正确率和训练集的正确率有一些差异是因为在训练模型时超拟合引起)
print('\nTest accuracy:', test_acc)  #输出正确率

probability_model = tf.keras.Sequential([model, tf.keras.layers.Softmax()])  #对顺序模型model附加一个softmax层来将逻辑转换为更容易解释的概率分布
predictions = probability_model.predict(x_test)  #使用模型预测x_test
print(np.argmax(predictions[0]))    #输出预测结果

class_names = ['T-shirt/top', 'Trouser', 'Pullover', 'Dress', 'Coat', 'Sandal', 'Shirt', 'Sneaker', 'Bag', 'Ankle boot']

def plot_image(i, predictions_array, true_label, img):
  predictions_array, true_label, img = predictions_array, true_label[i], img[i]
  plt.grid(False)
  plt.xticks([])
  plt.yticks([])

  plt.imshow(img, cmap=plt.cm.binary)

  predicted_label = np.argmax(predictions_array)
  if predicted_label == true_label:
    color = 'blue'
  else:
    color = 'red'

  plt.xlabel("{} {:2.0f}% ({})".format(class_names[predicted_label],
                                100*np.max(predictions_array),
                                class_names[true_label]),
                                color=color)

def plot_value_array(i, predictions_array, true_label):
  predictions_array, true_label = predictions_array, true_label[i]
  plt.grid(False)
  plt.xticks(range(10))
  plt.yticks([])
  thisplot = plt.bar(range(10), predictions_array, color="#777777")
  plt.ylim([0, 1])
  predicted_label = np.argmax(predictions_array)

  thisplot[predicted_label].set_color('red')
  thisplot[true_label].set_color('blue')

# 验证预测
# i = 0
# plt.figure(figsize=(6, 3))
# plt.subplot(1, 2, 1)
# plot_image(i, predictions[i], y_test, x_test)
# plt.subplot(1, 2, 2)
# plot_value_array(i, predictions[i],  y_test)
# plt.show()

num_rows = 1
num_cols = 4
num_images = num_rows * num_cols
plt.figure(figsize=(2*2*num_cols, 2*num_rows))
for i in range(num_images):
  plt.subplot(num_rows, 2*num_cols, 2*i+1)
  plot_image(i, predictions[i], y_test, x_test)
  plt.subplot(num_rows, 2*num_cols, 2*i+2)
  plot_value_array(i, predictions[i], y_test)
plt.tight_layout()
plt.show()
执行输出:
......
10000/10000 - 0s - loss: 0.3412 - accuracy: 0.8837

Test accuracy: 0.8837
9
经过训练的模型可以一次预测一组或一批测试集,也可以预测一个单独的图片,接上例添加如下代码:
img = x_test[1]
img = (np.expand_dims(img,0))  # 将二维数组转成三组数组(1,28,28)
predictions_single = probability_model.predict(img)
plot_value_array(1, predictions_single[0], y_test)
_ = plt.xticks(range(10), class_names, rotation=45)
plt.show()回调函数
Tensorboard, Earlystopping, ModelCheckping
1) Earlystopping 当loss不再下降时提前终止训练; monitor参数指定关注的指标,默认是验证集上损失函数的值; min_delta 连续两次指标的差值是否小于指定的阀值; patience连续多少次触发后执行Earlystopping;
2) ModelCheckping 将训练过程中所有参数的训练状态保存到文件; 同时也实现了断点续训;save_best_only=True 参数将最优模型保存,否则默认是最近的一个模型保存;save_weights_only=True 保存模型最优参数;
3) Tensorboard 是一个工具,它可以在模型训练中把模型变化趋势图输出;
import tensorflow as tf
import os
import numpy as np
import pandas as pd
from matplotlib import pyplot as plt

np.set_printoptions(threshold=np.inf)   #设置省略显示的阀值,inf表示无穷大

fashion = tf.keras.datasets.fashion_mnist
(x_train, y_train), (x_test, y_test) = fashion.load_data()
x_train, x_test = x_train / 255.0, x_test / 255.0

model = tf.keras.Sequential([
    tf.keras.layers.Flatten(input_shape=[28, 28]),
    tf.keras.layers.Dense(300, activation='relu'),
    tf.keras.layers.Dense(100, activation='relu'),
    tf.keras.layers.Dense(10, activation='softmax')
])

model.compile(optimizer='adam',
              loss=tf.keras.losses.SparseCategoricalCrossentropy(from_logits=False),
              metrics=['sparse_categorical_accuracy'])

logdir = './callbacks'
if not os.path.exists(logdir):
    os.mkdir(logdir)
output_model_file = os.path.join(logdir, "fashion_mnist_model.chk")
if os.path.exists(output_model_file + '.index'):
    print('-------------load the model-----------------')
    model.load_weights(output_model_file)

callbacks = [tf.keras.callbacks.TensorBoard(logdir),
              tf.keras.callbacks.ModelCheckpoint(filepath=output_model_file, save_best_only=True, save_weights_only=True),
              tf.keras.callbacks.EarlyStopping(patience=5, min_delta=1e-3)]

history = model.fit(x_train, y_train, epochs=10,
                    validation_data=(x_test, y_test),
                    callbacks=callbacks)

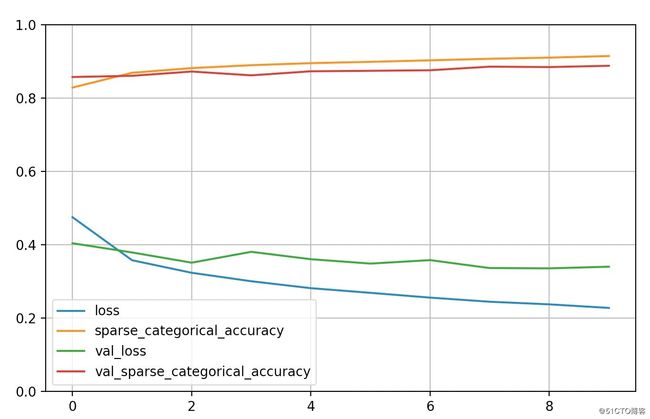
def plot_learning_curves(history):
    pd.DataFrame(history.history).plot(figsize=(8, 5))
    plt.grid(True)
    plt.gca().set_ylim(0, 1)
    plt.show()

plot_learning_curves(history)(tf) yuanjicai@localhost tf % tensorboard --logdir=callbacks
Serving TensorBoard on localhost; to expose to the network, use a proxy or pass --bind_all
TensorBoard 2.1.1 at http://localhost:6006/ (Press CTRL+C to quit)训练参数的保存及绘制正确率曲线和损失曲线
紧接上述代码,追加如下:
# print(model.trainable_variables)
file = open('./fashion_weights.txt', 'w')
#把所有可训练参数存入文本
for v in model.trainable_variables:
    file.write(str(v.name) + '\n')
    file.write(str(v.shape) + '\n')
    file.write(str(v.numpy()) + '\n')
file.close()

# 显示训练集和验证集的acc和loss曲线
#训练集loss: loss
#测试集loss: val_loss
#训练集准确率: sparse_categorical_accuracy
#测试集准确率: val_sparse_categorical_accuracy
acc = history.history['sparse_categorical_accuracy']
val_acc = history.history['val_sparse_categorical_accuracy']
loss = history.history['loss']
val_loss = history.history['val_loss']

plt.subplot(1, 2, 1)
plt.plot(acc, label='Training Accuracy')
plt.plot(val_acc, label='Validation Accuracy')
plt.title('Training and Validation Accuracy')
plt.legend()

plt.subplot(1, 2, 2)
plt.plot(loss, label='Training Loss')
plt.plot(val_loss, label='Validation Loss')
plt.title('Training and Validation Loss')
plt.legend()
plt.show()(tf) yuanjicai@localhost tf % ls fashion_weights.txt
fashion_weights.txt
(tf) yuanjicai@localhost tf % head -5 fashion_weights.txt
dense/kernel:0
(784, 300)
[[ 2.87062302e-02 3.47870290e-02 7.06149638e-03 8.09467956e-02
3.93384621e-02 -3.67978960e-02 5.82855269e-02 -1.32304523e-02
2.11584747e-01 -6.22368269e-02 1.44297266e-02 -1.10985190e-02
(tf) yuanjicai@localhost tf % 


