Plotly与chart_studio入门到放弃之系列一
Your charts. Your style. Your way.
Create, style and publish interactive web-ready charts
No coding required

最近买了一本《基于plotly的动态可视化绘图》,发现书还是跟不上官方文档啊!
在书上介绍还有官网介绍的记录plotly的Username和API_key,这里貌似在当前目录很难生成一个.plotly/.credentials,路过的有知道的可以在评论区留言让我明白一下!
发现在官网找到了这一句:Online features (plotly.plotly) moved to chart-studio package
给上官网最近新近版本的介绍:Version 4 Migration Guide in Python
- Replace
plotly.apiwithchart_studio.api - Replace
plotly.dashboard_objswithchart_studio.dashboard_objs - Replace
plotly.grid_objswithchart_studio.grid_objs - Replace
plotly.presentation_objswithchart_studio.presentation_objs - Replace
plotly.widgetswithchart_studio.widgets
貌似在官网中找到了一些眉目:online features已经迁移到chart_studio库中,貌似看起来还不错的样子!
import chart_studio
chart_studio.tools.set_credentials_file(
    username='', # 这儿就不放我自己的账号和api了
    api_key=''
    )
import chart_studio.plotly as py
from plotly.graph_objects import Scatter
trace0 = Scatter(
    x = [1, 2, 3, 4],
    y = [10, 15, 13, 17]
)
trace1 = Scatter(
    x = [1, 2, 3, 4],
    y = [16, 5, 11, 9]
)
data = ([trace0, trace1])
py.plot(data, filename='first_start')
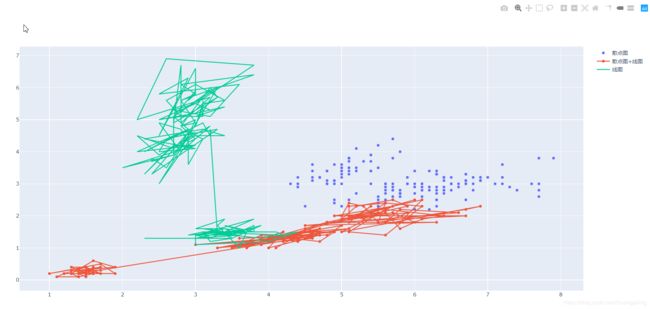
import plotly as py
import plotly.graph_objects as go
from sklearn.datasets import load_iris
plt = py.offline.plot
# 导入sklearn的数据集
iris = load_iris()
iris_X = iris.data  # 导入数据
iris_y = iris.target  # 导入标签
# create traces
trace0 = go.Scatter(
    x=iris_X[:, 0],  # 花萼长度
    y=iris_X[:, 1],  # 花萼宽度
    mode='markers',
    name='散点图'
)
trace1 = go.Scatter(
    x=iris_X[:, 2],  # 花瓣长度
    y=iris_X[:, 3],  # 花萼宽度
    mode='lines + markers',  # 散点图+线图
    name='散点图+线图'
)
trace2 = go.Scatter(
    x=iris_X[:, 1],  # 花萼长度
    y=iris_X[:, 2],  # 花瓣长度
    mode='lines',  # 线图
    name='线图'
)
data = [trace0, trace1, trace2]
plt(data, filename='base_picture.html')
接下来应系统的学习一下绘图参数,加上自己的灵感,争取在社区发布一个很好看的动态交互式绘图!
随机伪造了一点数据画了一个饼图
绘图代码如下:
import chart_studio
import chart_studio.plotly as py
from plotly.graph_objects import Pie, Layout, Figure
chart_studio.tools.set_credentials_file(
    username=' ',
    api_key=' '
    )
data = {
    'labels': ['直接用户', '经销商', 'OEM', '设备商', '个人'],
    'values': [180, 280, 30, 741, 59]
}
trace = Pie(
    labels=data['labels'],
    values=data['values'])
data_plot = [trace]
layout = Layout(title='Pie charts')
fig = Figure(data=data_plot, layout=layout)
py.plot(fig, filename='饼图')
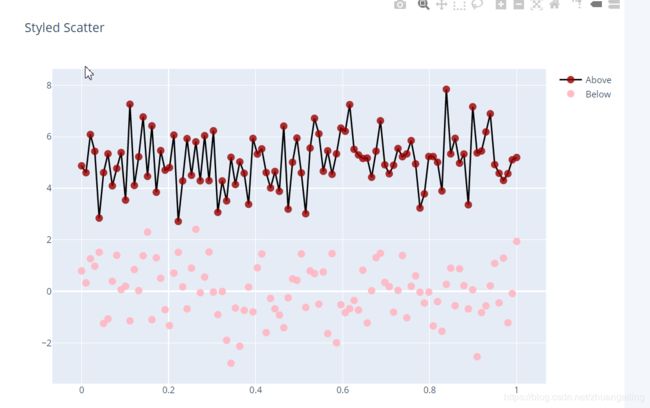
对上面的散点图做一些样式设置吧!
import numpy as np
import chart_studio
import chart_studio.plotly as py
from plotly.graph_objects import Scatter, Layout, Figure

chart_studio.tools.set_credentials_file(
    username='',
    api_key=''
    )

# 数据准备
N = 100
random_x = np.linspace(0, 1, N)
random_y1 = np.random.randn(N) + 5
random_y2 = np.random.randn(N)
random_y3 = np.random.randn(N) - 5

# 绘图
trace0 = Scatter(
    x=random_x,
    y=random_y1,
    name='Above',
    mode='markers+lines',
    marker=dict(
        size=10,    # 设置点的宽度
        color='rgba(152, 0, 0, 0.8)',   # 设置点的颜色
        ),
    line=dict(
        width=2,    # 设置线条的宽度
        color='rgb(0, 0, 0)'    # 设置线条的颜色
        )
    )
trace1 = Scatter(
    x=random_x,
    y=random_y2,
    name='Below',
    mode='markers',
    marker=dict(
        size=10,
        color='rgba(255, 182, 193, 0.9)',
        # line=dict(
        #    width=2,  # 设置点圈的宽度
        #    )
        )
    )

data = [trace0, trace1]
layout = Layout(
    title='Styled Scatter',
    yaxis=dict(zeroline=True),  # 显示y轴的0刻度线
    xaxis=dict(zeroline=False)  # 不显示x轴的0刻度线
    )
fig = Figure(data, layout=layout)
py.plot(fig, filename='Scatter_style.html')
在书上的代码块对重要参数markers的设置如下:
marker=dict(
        size=10,    # 设置点的宽度
        color='rgba(152, 0, 0, 0.8)',   # 设置点的颜色
	    line=dict(
        	width=2,    # 设置线条的宽度
        	color='rgb(0, 0, 0)'    # 设置线条的颜色
        )
    )
这里将line参数的设置放进了marker中,个人觉得,从逻辑和思考上来看,应该单独的对点和线条分别进行参数的设置,这样看起来的结构和逻辑都是很清晰的!在Scatter函数中给出了绘制线形图与散点图的主要参数。
connectgaps: 布尔变量,用于连接缺失数据dx, dy:x, y 坐标轴的步进值,默认值是1error_x、error_y:x、y出错信息fillcolor:填充颜色fill:填充模式,包括格式、颜色等hoverinfo:当用户与图形交互时,鼠标指针显示的参数,包括x、y、z坐标数据以及text(文字信息)、name(图形名称)等参数的组合,可使用+、all、none和skip(忽略)作为组合链接符号,默认是all(全部消失)。hoveron:当用户与图形交互时,鼠标指针显示的模式,包括points(点图)、fills(填充图)和points+fills(点图+填充图)三种模式。ids:在动画图表中,数据点和图形key键的列表参数legendgroup:图例参数,默认是空字符串line:线条参数,包括线条宽度、颜色、格式等marker:数据节点参数,包括大小、颜色、格式等mode:图形格式,包括lines(线形图)、markers(散点图)和text(文本),使用+或none等符号进行模式组合name:名称参数。opacity:透明度参数,范围是0~1rsrc、xsrc、tsrc、idssrc、textsrc、textpositionsrc:字符串源数组列表,可作为plotly网格标识符,用于设置特殊图标所需的r参数、x参数、y参数、t参数、ids参数、text参数和textposition参数r、t:用于极坐标图,r设置径向坐标(半径)、t用于设置角坐标showlegend:布尔变量,用于切换图标显示stream:数据流,用于实时显示数据图标textfont:文本字体参数,包括字体名称、颜色、大小等textposition:“文本”元素的位置参数,包括top left、top center、top right、middle left、middle center、middle right、bottom left、bottom center、bottom right。text:文本数据,设置每个“(x,y)对”关联的文本元素和数组列表格式,默认是空字符串type:数据显示模式,包括constant(常数)、percent(百分比)、sqrt(平方根)、array(数组)格式x0、y0:坐标轴起点坐标xaxis、yaxis:x、y坐标参数xcalender、ycalender:坐标时间参数的格式,默认是公历(gregorian),支持gregorian、chinese、coptic、discworld、ethiopian、hebrew、islamic、julian、mayan、nanakshahi、persian、jalali、taiwan、thai和ummalqura格式x,y:设置x、y轴的坐标数据
看了参数之后的感觉,对图形的思考是否多了一点灵魂?
个人将在后面的时间对plotly书上的图进一步的进行思考!


