贝叶斯决策、朴素贝叶斯算法与词频统计
贝叶斯决策
概率公式
- 事件A发生的可能性:记为 P ( A ) P(A) P(A)
- 事件A和事件B同时发生的概率:记为 P ( A B ) P(AB) P(AB)
- 条件概率:设 A , B A,B A,B为任意两个事件,若 P ( A ) > 0 P(A)>0 P(A)>0,我们称在已知事件A发生的条件下,事件B发生的概率为条件概率,记为 P ( B ∣ A ) P(B|A) P(B∣A), P ( B ∣ A ) = P ( A B ) P ( A ) P(B|A)=\frac{P(AB)}{P(A)} P(B∣A)=P(A)P(AB)
- 全概率公式:
如果 ⋃ i = 1 n A i = Ω , A i A j = ϕ ( 对一切 i ≠ j ) , P ( A i ) > 0 \bigcup_{i=1}^{n} A_{i}=\Omega, \quad A_{i} A_{j}=\phi(\text { 对一切 } i \neq j) \quad, \quad \mathrm{P}\left(\mathrm{A}_{i}\right)>0 ⋃i=1nAi=Ω,AiAj=ϕ( 对一切 i=j),P(Ai)>0,则对于任一事件 B B B,有 P ( B ) = ∑ i = 1 n P ( A i ) P ( B ∣ A i ) P(B)=\sum^{n}_{i=1}P(A_i)P(B|A_i) P(B)=i=1∑nP(Ai)P(B∣Ai)

从图上看就是, B B B发生的概率等于 B B B与 A i A_i Ai同时发生的概率相加 - 贝叶斯公式(逆概率公式)
如果 ⋃ i = 1 n A i = Ω , A i A j = ϕ ( 对一切 i ≠ j ) , P ( A i ) > 0 \bigcup_{i=1}^{n} A_{i}=\Omega, \quad A_{i} A_{j}=\phi(\text { 对一切 } i \neq j) \quad, \quad \mathrm{P}\left(\mathrm{A}_{i}\right)>0 ⋃i=1nAi=Ω,AiAj=ϕ( 对一切 i=j),P(Ai)>0,则对于任一事件 B B B,只要 P ( B ) > 0 P(B)>0 P(B)>0,有 P ( A j ∣ B ) = P ( A j B ) P ( B ) = P ( A j ) P ( B ∣ A j ) ∑ i = 1 n P ( A i ) P ( B ∣ A i ) ( i , j = 1 , 2 , … , n ) P\left(A_{j} | B\right)=\frac{P\left(A_{j} B\right)}{P(B)}=\frac{P\left(A_{j}\right) P\left(B | A_{j}\right)}{\sum_{i=1}^{n} P\left(A_{i}\right) P\left(B | A_{i}\right)}(i, j=1,2, \ldots, n) P(Aj∣B)=P(B)P(AjB)=∑i=1nP(Ai)P(B∣Ai)P(Aj)P(B∣Aj)(i,j=1,2,…,n)
基于风险最小化的贝叶斯准则
假设有 N N N个类别: y = { c 1 , c 2 , … , c n } y=\{c_1,c_2,\ldots,c_n \} y={c1,c2,…,cn},基于后验概率 P ( c i ∣ x ) P(c_i|x) P(ci∣x)将样本 x x x分到 c i c_i ci的风险(也称期望损失)为:
R ( c i ∣ x ) = ∑ j = 1 N l o s s i j P ( c j ∣ x ) R(c_i|x)=\sum^{N}_{j=1} loss_{ij}P(c_j|x) R(ci∣x)=j=1∑NlossijP(cj∣x),其中 l o s s i j loss_{ij} lossij为将样本分类错误产生的损失。
- 贝叶斯判定准则:要使总体风险最小化,则只需要每个样本的条件风险 R ( c i ∣ x ) R(c_i|x) R(ci∣x)最小化。即:
h ∗ ( x ) = arg min c ∈ Y R ( c ∣ x ) h^{*}(\boldsymbol{x})=\underset{c \in \mathcal{Y}}{\arg \min } R(c | \boldsymbol{x}) h∗(x)=c∈YargminR(c∣x)
h ∗ h^{*} h∗称为贝叶斯最优分类器,总体风险: R ( h ∗ ) = E x [ R ( h ∗ ( x ) ∣ x ) ] R(h^{*})=E_x[R(h^{*}(x)|x)] R(h∗)=Ex[R(h∗(x)∣x)]称为贝叶斯风险, 1 − R ( h ∗ ) 1-R(h^{*}) 1−R(h∗)反映分类器达到的最佳精度
基于错误率最小化的贝叶斯准则
对于最小化分类错误率,将分类错误损失记为 l o s s i j = { 0 , i = j 1 , i ≠ j loss_{i j}=\left\{\begin{array}{ll} 0, & {i = j} \\ 1, & { i \ne j } \end{array}\right. lossij={0,1,i=ji=j
- 条件风险变为: R ( c ∣ x ) = 1 − P ( c ∣ x ) R(c|x)=1-P(c|x) R(c∣x)=1−P(c∣x)
- 最优分类器准则为: h ∗ ( x ) = arg min c ∈ Y P ( c ∣ x ) h^{*}(\boldsymbol{x})=\underset{c \in \mathcal{Y}}{\arg \min } P(c | \boldsymbol{x}) h∗(x)=c∈YargminP(c∣x),即将样本 x x x分为后验概率 P ( c ∣ x ) P(c|x) P(c∣x)最大的类别标记。
两种模型
- 判别模型:给定样本 x x x通过直接建模 P ( c ∣ x ) P(c|x) P(c∣x)来预测 c i c_i ci。决策树、BP神经网络、支持向量机、线性回归、逻辑回归等属于判别模型
- 生成模型:对联合概率分布 P ( x , c ) P(x,c) P(x,c)建模,再由此获得 P ( c ∣ x ) P(c|x) P(c∣x)。朴素贝叶斯、高斯混合模型、隐马尔科夫模型等属于生成模型。
- 关系:由生成模型可以得到判别模型,但由判别模型得不到生成模型。
朴素贝叶斯算法
- 朴素贝叶斯算法属于生成模型,对于生成模型考虑: P ( c ∣ x ) = P ( x , c ) P ( x ) P(c|x)=\frac{P(x,c)}{P(x)} P(c∣x)=P(x)P(x,c),用于文本分类中
使用条件概率公式: P ( c ∣ x ) = P ( c ) P ( x ∣ c ) P ( x ) P(c|x)=\frac{P(c)P(x|c)}{P(x)} P(c∣x)=P(x)P(c)P(x∣c), P ( c ) P(c) P(c)为每个类别的概率,是先验概率, P ( x ∣ c ) P(x|c) P(x∣c)为样本在类别 c c c中发生的条件概率。
- 先验概率 P ( c ) P(c) P(c),根据大数定律,可通过各类样本出现的频率来进行估计
- 条件概率 P ( x ∣ c ) = P ( x c ) P ( c ) P(x|c)=\frac{P(xc)}{P(c)} P(x∣c)=P(c)P(xc)。不过对于较大的数据集中,直接使用频率估计 P ( x ∣ c ) P(x|c) P(x∣c)不可行。因此,可使用极大似然估计法进行估计,先前已介绍过极大似然估计,这里就不介绍了。
朴素贝叶斯分类器
为解决 P ( c ∣ x ) P(c|x) P(c∣x)难以估计的问题,朴素贝叶斯是基于贝叶斯定理与特征条件独立假设的分类方法。因此, P ( c ∣ x ) = P ( c ) P ( x ∣ c ) P ( x ) = P ( c ) P ( x ) ∏ i = 1 n P ( x i ∣ c ) P(c | \boldsymbol{x})=\frac{P(c) P(\boldsymbol{x} | c)}{P(\boldsymbol{x})}=\frac{P(c)}{P(\boldsymbol{x})} \prod_{i=1}^{n} P\left(x_{i} | c\right) P(c∣x)=P(x)P(c)P(x∣c)=P(x)P(c)i=1∏nP(xi∣c)
对于所有类别来说, P ( x ) P(x) P(x)是相同的,所以朴素贝叶斯分类器为:
h n b ( x ) = arg max c ∈ Y P ( c ) ∏ i = 1 d P ( x i ∣ c ) h_{n b}(\boldsymbol{x})=\underset{c \in \mathcal{Y}}{\arg \max } P(c) \prod_{i=1}^{d} P\left(x_{i} | c\right) hnb(x)=c∈YargmaxP(c)i=1∏dP(xi∣c)
小例子
假设有一训练集集包含100个人,包含身体颜色特征和头发形状特征,其中有60个非洲人(黑卷*47, 黑直*1, 黄卷*11, 黄直*1),有40个亚洲人(黑卷*1, 黄卷*4, 黄直*35)
- 计算先验概率: P ( 非 洲 ) = 60 100 , P ( 亚 洲 ) = 40 100 P(非洲)=\frac{60}{100},P(亚洲)=\frac{40}{100} P(非洲)=10060,P(亚洲)=10040
- 计算每个特征的条件概率:

- 预测样本 (黑,卷,地区未知) 属于哪个地区,根据朴素贝叶斯算法: P ( 非 洲 ∣ 黑 卷 ) = P ( 非 洲 ) P ( 黑 ∣ 非 洲 ) P ( 卷 ∣ 非 洲 ) = 60 ∗ 48 ∗ 58 100 ∗ 60 ∗ 60 P ( 亚 洲 ∣ 黑 卷 ) = P ( 亚 洲 ) P ( 黑 ∣ 亚 洲 ) P ( 卷 ∣ 亚 洲 ) = 40 ∗ 1 ∗ 5 100 ∗ 40 ∗ 40 P(非洲|黑卷)=P(非洲)P(黑|非洲)P(卷|非洲)=\frac{60*48*58}{100*60*60} \newline P(亚洲|黑卷)=P(亚洲)P(黑|亚洲)P(卷|亚洲)=\frac{40*1*5}{100*40*40} P(非洲∣黑卷)=P(非洲)P(黑∣非洲)P(卷∣非洲)=100∗60∗6060∗48∗58P(亚洲∣黑卷)=P(亚洲)P(黑∣亚洲)P(卷∣亚洲)=100∗40∗4040∗1∗5
因此,这个样本预测为非洲地区的
拉普拉斯平滑
若数据集中出现某个属性值在训练集中没有与某个类同时出现过,
假设 P ( 卷 ∣ 非 洲 ) = 0 P(卷|非洲)=0 P(卷∣非洲)=0, P ( 卷 ∣ 亚 洲 ) = 0.001 P(卷|亚洲)=0.001 P(卷∣亚洲)=0.001,则样本(黑,卷,地区未知) 会被预测为亚洲地区: P ( 非 洲 ∣ 黑 卷 ) = P ( 非 洲 ) P ( 黑 ∣ 非 洲 ) P ( 卷 ∣ 非 洲 ) = 0 P ( 亚 洲 ∣ 黑 卷 ) = P ( 亚 洲 ) P ( 黑 ∣ 亚 洲 ) P ( 卷 ∣ 亚 洲 ) = 0.00001 P(非洲|黑卷)=P(非洲)P(黑|非洲)P(卷|非洲)=0 \newline P(亚洲|黑卷)=P(亚洲)P(黑|亚洲)P(卷|亚洲)=0.00001 P(非洲∣黑卷)=P(非洲)P(黑∣非洲)P(卷∣非洲)=0P(亚洲∣黑卷)=P(亚洲)P(黑∣亚洲)P(卷∣亚洲)=0.00001由于P(卷|非洲)概率为0,导致无论样本其他属性如何,都会被预测为亚洲地区,这显然不合理。
- 为避免这种情况发生,使用了平滑操作
- 改造先验概率公式:
P ( 非 洲 ) = 60 + λ 100 + l e n [ 亚 洲 , 非 洲 ] ⋅ λ = 60 + λ 100 + 2 λ P(非洲)=\frac{60+\lambda}{100+len[亚洲,非洲] \cdot \lambda}=\frac{60+\lambda}{100+2\lambda} P(非洲)=100+len[亚洲,非洲]⋅λ60+λ=100+2λ60+λ
− − − − − − − − − − ---------- −−−−−−−−−−
一般形式: P ( c i ) = D c i + λ D + N ∗ λ P(c_i)=\frac{D_{c_i}+\lambda}{D+N*\lambda} P(ci)=D+N∗λDci+λ, c i c_i ci为某个类别, D c i D_{c_i} Dci为该类别的样本数, D D D为训练集个数, N N N为训练集中可能的类别数
− − − − − − − − − − ---------- −−−−−−−−−− - 改造每个特征的条件概率公式:
P ( 黑 ∣ 非 洲 ) = 48 + λ 60 + l e n [ 黑 , 白 ] ⋅ λ = 48 + λ 60 + 2 λ P(黑|非洲)=\frac{48+\lambda}{60+len[黑,白] \cdot \lambda}=\frac{48+\lambda}{60+2\lambda} P(黑∣非洲)=60+len[黑,白]⋅λ48+λ=60+2λ48+λ
P ( 直 ∣ 非 洲 ) = 2 + λ 60 + l e n [ 直 , 卷 ] ⋅ λ = 2 + λ 60 + 2 λ P(直|非洲)=\frac{2+\lambda}{60+len[直,卷] \cdot \lambda}=\frac{2+\lambda}{60+2\lambda} P(直∣非洲)=60+len[直,卷]⋅λ2+λ=60+2λ2+λ
− − − − − − − − − − ---------- −−−−−−−−−−
一般形式: P ( x i ∣ c i ) = D c i x i + λ D c i + N i ∗ λ P(x_i|c_i)=\frac{D_{c_i x_i}+\lambda}{D_{c_i}+N_i *\lambda} P(xi∣ci)=Dci+Ni∗λDcixi+λ, c i c_i ci为某个类别, x i x_i xi为该类别下的某个特征(属性), D c i D_{c_i} Dci为该类别 c i c_i ci的样本数, D c i x i D_{c_i x_i} Dcixi为类别 c i c_i ci的特征 x i x_i xi的个数, N i N_i Ni为类别 c i c_i ci中可能的特征数
− − − − − − − − − − ---------- −−−−−−−−−−
- λ > 0 \lambda>0 λ>0,当 λ = 1 \lambda=1 λ=1时,称为拉普拉斯平滑
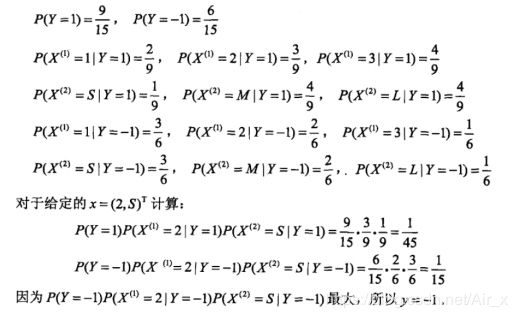
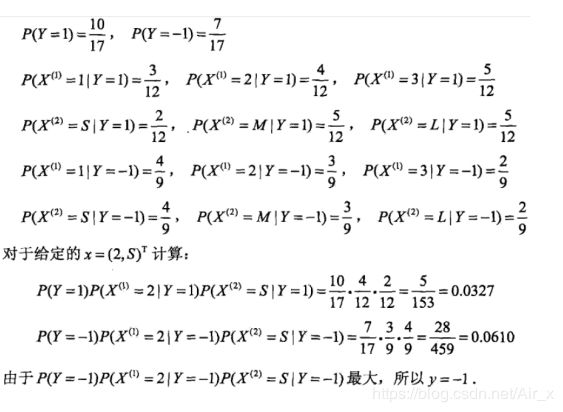
例子
不进行平滑操作
进行拉普拉斯平滑操作
python实现
# python3.7
# -*- coding: utf-8 -*-
#@Author    : huinono
#@Software  : PyCharm

import warnings
import numpy as np
import pandas as pd
import matplotlib as mpl
import matplotlib.pyplot as plt

warnings.filterwarnings('ignore')

mpl.rcParams['font.sans-serif'] = 'SimHei'
mpl.rcParams['axes.unicode_minus'] = 'False'

plt.rcParams['font.sans-serif'] = 'SimHei'
plt.rcParams['axes.unicode_minus'] = 'False'

class bayes_principle(object):
    def __init__(self):
        pass

    def tokey(self,col_name,category, y):
        # 定义写key的函数,比如产生字符 'X1=3|Y=1'
        return col_name + "=" + str(category) + "|Y=" + str(y)

    def run(self):
        df = pd.read_csv("../datas/bayes_lihang.txt")
        print(df.T)
        lam = 1  # 拉普拉斯  平滑因子
        P = {}  # 用于存储所有概率的字典
        Y = df["Y"].value_counts().keys()  # 获取类别种类的list   Y = [1, -1]
        col_names = df.columns.tolist()[:-1]  # 获取特征列名   x1,x2
        "使用拉普拉斯平滑处理,计算概率,并使用字典存储"
        for y in Y:  # 遍历每个类别
            df2 = df[df["Y"] == y]  #
            p = (df2.shape[0] + lam) / (df.shape[0] + len(Y) * lam)  # 计算先验概率
            P[y] = p  # 将先验概率加入P
            for col_name in col_names:  # 遍历每个特征
                categorys = df2[col_name].value_counts().keys()  # 获取每个特征下特征值种类的list
                for category in categorys:  # 遍历每个特征值
                    p = (df2[df2[col_name] == category].shape[0] + lam) / (
                        # 计算在某类别下,特征=某特征的条件概率
                            df2.shape[0] + len(categorys) * lam)
                    P[self.tokey(col_name, category, y)] = p  # 将条件概率加到P

        X = [2, "S"]
        res = []  # 用于存储属于某一类别的后验概率
        for y in Y:  # 遍历类别
            p = P[y]  # 获取先验概率
            for i in range(len(X)):  # 遍历特征
                p *= P[self.tokey(col_names[i], X[i], y)]  # 获取条件概率
            # print(p)
            res.append(p)  # 将后验概率加入res
        print(res)
        print(Y[np.argmax(res)])  # 返回最大的后验概率对应的类别
特征工程之词频统计
文本类数据处理的最重要的是需要将文本数据转换为数值型数据,一般情况是将文本转换为一个向量
TF(term frequency)与TF-IDF(term frequency–inverse document frequency)
- T F = 某 词 在 文 中 出 现 次 数 TF=某词在文中出现次数 TF=某词在文中出现次数
- I D F = log 1 + n d 1 + d f ( d , t ) + 1 IDF=\log \frac{1+n_d}{1+df(d,t)}+1 IDF=log1+df(d,t)1+nd+1, n d n_d nd表示文章数量, d f df df表示某词在该词文档中出现的频数
- T F − I D F = T F ∗ I D F TF-IDF=TF*IDF TF−IDF=TF∗IDF
为什么有TF-IDF:
在文章中,出现次数最多的词是----“的”、“是”、“在”、‘the’、‘a’、'is’等等----这一类最常用的词,这些词对文档的实际内容几乎没有任何有意义的信息。如果我们把这些数据直接输入分类器,那么这些非常频繁的词将掩盖一些重要词的频率和结果。
为了将计数特性重新加权为适合分类器使用的浮点值,通常使用TF-IDF转换。
例子
有文本[‘我爱你’ , ‘我恨你恨你’’],计算"爱"字的TF与TF-IDF:
T F = 1 TF=1 TF=1, I D F = log 1 + 2 1 + 1 + 1 = 1.405 IDF=\log \frac{1+2}{1+1}+1=1.405 IDF=log1+11+2+1=1.405, T F − I D F = 1 × 1.405 = 1.405 TF-IDF=1 ×1.405=1.405 TF−IDF=1×1.405=1.405
python实现
import numpy as np
import pandas as pd
from sklearn.feature_extraction.text import CountVectorizer,TfidfVectorizer
class WordFrequency(object):
    def __init__(self):
        pass
    def TF(self):
        X = ['我 爱 你', '我 恨 你 恨 你']
        # 正则化处理,有效字符为字母数字和汉字
        countCoder = CountVectorizer(token_pattern="[a-zA-Z|\u4e00-\u9fa5]+")
        X = countCoder.fit_transform(X)
        print(countCoder.get_feature_names())
        print(X.toarray())

    def TF_IDF(self):
        X = ['我 爱 你', '我 恨 你 恨 你']
        tiCoder = TfidfVectorizer(norm=None, token_pattern="[a-zA-Z|\u4e00-\u9fa5]+")
        X2 = tiCoder.fit_transform(X)
        print(tiCoder.get_feature_names())
        print(X2.toarray())
贝叶斯家族简介
多项式朴素贝叶斯
伯努利朴素贝叶斯
高斯朴素贝叶斯
python实现一些数据分类
# python3.7
# -*- coding: utf-8 -*-
#@Author    : huinono
#@Software  : PyCharm

import warnings
import numpy as np
import pandas as pd
import matplotlib as mpl
import matplotlib.pyplot as plt
from sklearn.pipeline import Pipeline
from sklearn.metrics import accuracy_score
from sklearn.neighbors import KNeighborsClassifier
from sklearn.model_selection import train_test_split
from sklearn.naive_bayes import MultinomialNB,GaussianNB
from sklearn.feature_extraction.text import CountVectorizer,TfidfVectorizer
from sklearn.preprocessing import StandardScaler

class NBayes_sklearn(object):
    def __init__(self):
        pass
    def text_classifier(self):
        df = pd.read_csv("../datas/bayes_xinxi.txt")  # 读取数据
        # 正则匹配,a-z,A-Z,所有中文
        tfCoder = CountVectorizer(token_pattern="[a-zA-Z|\u4e00-\u9fa5]+")  # TF模型
        X = df["words"]
        Y = df["Y"]
        X = tfCoder.fit_transform(X)  # 训练TF模型
        print(tfCoder.get_feature_names())
        print(X.toarray())
        X_ = ["Chinese Chinese Chinese Tokyo Japan"]  # 训练数据
        X_ = tfCoder.transform(X_).A  # A相当于toarray() 将训练数据转为array类型
        model = MultinomialNB()
        model.fit(X, Y)
        print(model.predict(X_))
        print('-----------')
        print(Y[model.predict(X_)])

    def gametext(self):
        df = pd.read_csv("../datas/bayes_wangzhe.txt", header=None)
        X = df[1]
        Y = df[0]
        tfCoder = TfidfVectorizer(token_pattern="[a-zA-Z|\u4e00-\u9fa5]+")
        X = tfCoder.fit_transform(X)
        print(tfCoder.get_feature_names())
        print(X.toarray())
        X_train, X_test, y_train, y_test = train_test_split(X, Y, test_size=0.2, random_state=42)
        model = MultinomialNB()
        model.fit(X_train, y_train)
        print(model.predict(X_train))
        print(y_train.values)
        a = ["残血 的 安琪拉 打 不 过 鲁班", "这 一波 大龙 别 再 被 抢 了",
             "你 在 石头 那 不要 动,我 去 买 几个 橘子"]
        # print(tfCoder.transform(a).todense())
        print(model.predict(tfCoder.transform(a)))

    def iris_classifier(self):
        # 花萼长度、花萼宽度,花瓣长度,花瓣宽度
        iris_feature_E = 'sepal length', 'sepal width', 'petal length', 'petal width'
        iris_feature_C = u'花萼长度', u'花萼宽度', u'花瓣长度', u'花瓣宽度'
        iris_class = 'Iris-setosa', 'Iris-versicolor', 'Iris-virginica'
        features = [0, 2]
        ## 读取数据
        path = '../datas/iris.data'  # 数据文件路径,也可以直接使用sklearn内的鸢尾花数据集
        data = pd.read_csv(path, header=None)
        x = data[list(range(4))]
        x = x[features]
        y = pd.Categorical(data[4]).codes  ## 直接将数据特征转换为0,1,2
        print("总样本数目:%d;特征属性数目:%d" % x.shape)
        ## 0. 数据分割,形成模型训练数据和测试数据
        x_train, x_test, y_train, y_test = train_test_split(x, y, train_size=0.8, random_state=14)
        print("训练数据集样本数目:%d, 测试数据集样本数目:%d" % (x_train.shape[0], x_test.shape[0]))
        ## 高斯贝叶斯模型构建
        clf = Pipeline([
            ('sc', StandardScaler()),  # 标准化,把它转化成了高斯分布
            ('clf', GaussianNB())])
        ## 训练模型
        clf.fit(x_train, y_train)
        #计算准确度
        y_train_hat = clf.predict(x_train)
        print('训练集准确度: %.2f%%' % (100 * accuracy_score(y_train, y_train_hat)))
        y_test_hat = clf.predict(x_test)
        print('测试集准确度:%.2f%%' % (100 * accuracy_score(y_test, y_test_hat)))
        "画图"
        N, M = 500, 500  # 横纵各采样多少个值

        # 生成画图的图像区域
        x1_min1, x2_min1 = x_train.min()
        x1_max1, x2_max1 = x_train.max()
        x1_min2, x2_min2 = x_test.min()
        x1_max2, x2_max2 = x_test.max()
        x1_min = np.min((x1_min1, x1_min2))
        x1_max = np.max((x1_max1, x1_max2))
        x2_min = np.min((x2_min1, x2_min2))
        x2_max = np.max((x2_max1, x2_max2))

        t1 = np.linspace(x1_min, x1_max, N)
        t2 = np.linspace(x2_min, x2_max, N)
        x1, x2 = np.meshgrid(t1, t2)  # 生成网格采样点
        x_show = np.dstack((x1.flat, x2.flat))[0]  # 测试点

        cm_light = mpl.colors.ListedColormap(['#77E0A0', '#FF8080', '#A0A0FF'])
        cm_dark = mpl.colors.ListedColormap(['g', 'r', 'b'])
        y_show_hat = clf.predict(x_show)  # 预测值
        y_show_hat = y_show_hat.reshape(x1.shape)

        ## 画图
        plt.figure(facecolor='w')
        plt.pcolormesh(x1, x2, y_show_hat, cmap=cm_light)  # 预测值的显示
        plt.scatter(x_train[features[0]], x_train[features[1]], c=y_train, edgecolors='k', s=50, cmap=cm_dark)
        plt.scatter(x_test[features[0]], x_test[features[1]], c=y_test, marker='^', edgecolors='k', s=120, cmap=cm_dark)
        plt.xlabel(iris_feature_C[features[0]], fontsize=13)
        plt.ylabel(iris_feature_C[features[1]], fontsize=13)
        plt.xlim(x1_min, x1_max)
        plt.ylim(x2_min, x2_max)
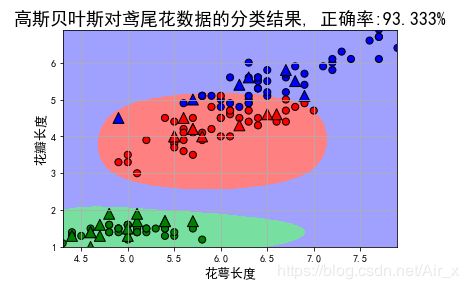
        plt.title(u'高斯贝叶斯对鸢尾花数据的分类结果, 正确率:%.3f%%' % (100 * accuracy_score(y_test, y_test_hat)), fontsize=18)
        plt.grid(True)
        plt.show()

if __name__ == '__main__':
    NBayes = NBayes_sklearn()
    NBayes.iris_classifier()


