均值回归_Mean Reverting Strategy
0. 引库
%matplotlib inline
import matplotlib.pyplot as plt
import seaborn
plt.style.use('seaborn')
import matplotlib as mpl
mpl.rcParams['font.family'] = 'serif'
import warnings; warnings.simplefilter('ignore')
import numpy as np
import pandas as pd
import tushare as ts
1. 数据准备 & 回测准备
data = ts.get_k_data('hs300', start = '2010-01-01', end='2016-06-30')[['date','close']]
data.rename(columns={'close': 'price'}, inplace=True)
data.set_index('date', inplace = True)
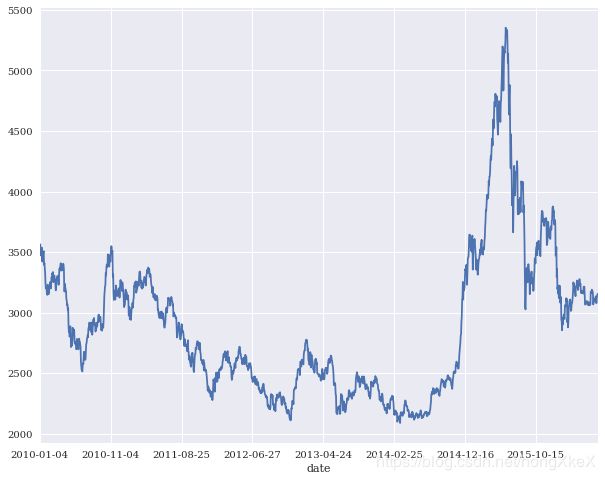
data['price'].plot(figsize = (10,8));

data.head()
|
price |
| date |
|
| 2010-01-04 |
3535.229 |
| 2010-01-05 |
3564.038 |
| 2010-01-06 |
3541.727 |
| 2010-01-07 |
3471.456 |
| 2010-01-08 |
3480.130 |
2. 策略开发思路
data['returns'] = np.log(data['price'] / data['price'].shift(1))
SMA = 50
data['SMA'] = data['price'].rolling(SMA).mean()
data.tail()
|
price |
returns |
SMA |
| date |
|
|
|
| 2016-06-24 |
3077.16 |
-0.012967 |
3135.5614 |
| 2016-06-27 |
3120.54 |
0.013999 |
3132.7446 |
| 2016-06-28 |
3136.40 |
0.005070 |
3129.9560 |
| 2016-06-29 |
3151.39 |
0.004768 |
3127.5396 |
| 2016-06-30 |
3153.92 |
0.000802 |
3126.0490 |
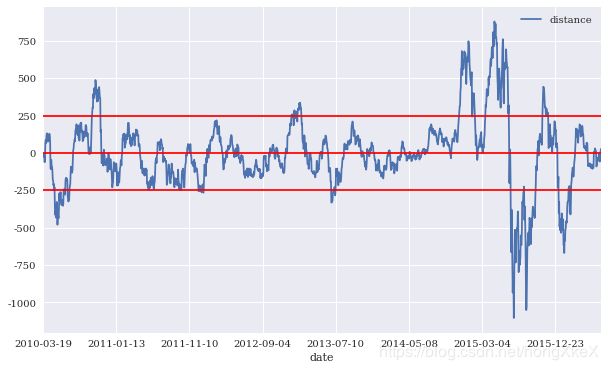
threshold = 250
data['distance'] = data['price'] - data['SMA']
data['distance'].dropna().plot(figsize=(10, 6), legend=True);
plt.axhline(threshold, color='r');
plt.axhline(-threshold, color='r');
plt.axhline(0, color='r');

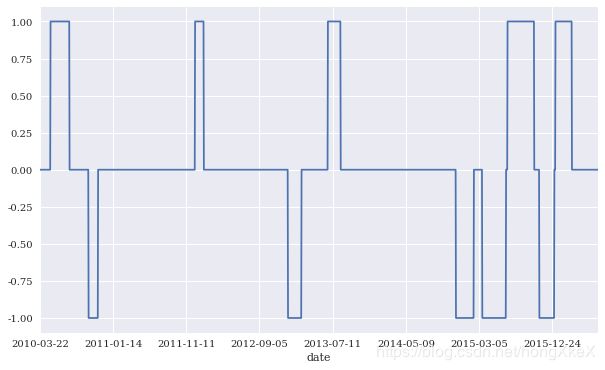
data['position'] = np.where(data['distance'] > threshold, -1, np.nan)
data['position'] = np.where(data['distance'] < -threshold, 1, data['position'])
data['position'] = np.where(data['distance'] * data['distance'].shift(1) < 0, 0, data['position'])
data['position'] = data['position'].ffill().fillna(0)
data['position'].ix[SMA:].plot(ylim=[-1.1, 1.1], figsize=(10, 6));

3. 计算策略年化收益并可视化
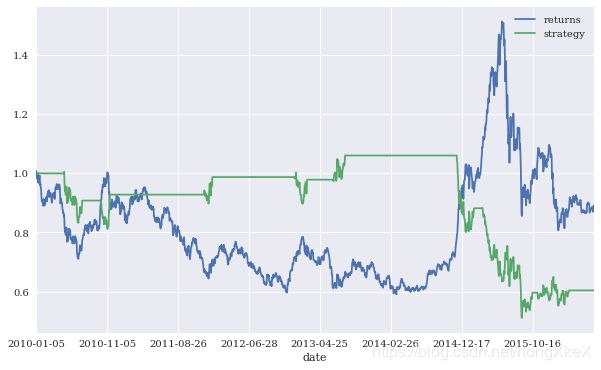
data['strategy'] = data['position'].shift(1) * data['returns']
data[['returns', 'strategy']].dropna().cumsum().apply(np.exp).plot(figsize=(10, 6));

data[['returns', 'strategy']].mean() * 252
returns    -0.018261
strategy   -0.080739
dtype: float64
策略思想总结
均值回归策略应用了股市投资中经典的高抛低吸思想,该类策略一般在震荡市中表现优异;但在单边趋势行情中一般表现糟糕,往往会大幅跑输市场


