项目简介
文章里有相当多的用到中学数学中的知识,推导3d的几何模型是如何绘制到2d平面中去的,最终利用推导出的结论编写代码,实现一个波纹的demo
项目地址:https://github.com/zz632893783/canvas-3d
安装项目依赖模块
npm install
运行项目
npm run dev
从z轴观察yz平面上的点

想象一下有这么一个三维空间(如图),有一个点B,我们从A点观察B点。那么B点在xy平面上的投影即AB的延长线与平面xy的交点C。而xy平面不就是可以看一个二维的canvas画布吗。
我们暂且将A点放在z轴,B点放在yz平面,则A点的三维坐标可以表示为
A(0,0,zA),B点的三维坐标可以表示为B(0,yB,zB)。从B点做一条垂线垂z轴于D点。
ADB与AOC是相似三角形,所以有
变换得
其中DB即B点的y坐标,AO即A点的z坐标,DO即B点的z坐标,所以
这里的OC也就是C点的y坐标。
从z轴观察xz平面上的点

同理我们从A点观察平面xz上的某一点E(xE,0,zE),ADE与AOF是相似三角形
变换得
从z轴观察空间内任意坐标
之前所观测的B点是位于yz平面内,E点是位于xz平面内,但是如果是空间内任意位置的点呢
其实道理都是一样的,如下如

如果将直线BD平移到E点,直线DE平移到B点,那么将形成一个矩形DBGE,矩形DBGE在xy平面上的投影为矩形OCHF。
由于AGE与AHF相似,所以有
并且由于ADE与AOF也是相似三角形,所以
所以
推导得
其中GE也就是G点的y坐标,因为矩形DBGE是平行于xy平面的,所以它们z坐标相同,DO等价于G点的z坐标,所以对于空间内任意位置G(xG,yG,zG)
同样的方法我们可以推导出
变换得
结合上两步,CH是H点的x坐标,HF是H点的y坐标,所以从轴上的点A(0,0,zA)观察空间内任意位置G(xG,yG,zG)在平面xy上的投影可表示为
从任意位置观察空间内任意坐标
沿着x轴平移坐标系
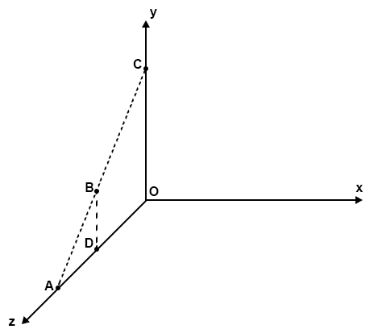
之前的推论到从z轴观察空间内任意位置的投影了,但是实际上A点是有特殊性的,因为它是位于z轴上的某一个点,其xy坐标都为0,如果A是空间内的任意一个点,情况又如何,请看下图

假设这个时候真正的坐标系是xy'z',而坐标系xyz是我们临时所建立的一个虚拟的坐标系,那么这个时候A点相对于坐标系xy'z'来说,坐标点可表示为A(xA,0,zA),G点依旧表示为(xG,yG,zG)
我们之前推导的相似三角形的关系,即使换了坐标系,它们的关系依然成立,所以
变换得
只不过这个时候 BG=xG-xA,AO与DO与之前相同
求得
之前推导出的相似三角形关系依旧成立,所以
变换得
由于GE,AO,DO与之前相比都没有变化,
所以得
与之前的推导一致,最后我们得出结论,我们沿着x轴方向移动坐标系的时候(即图中的坐标系有xy'z'移动到了xyz位置),G点在平面xy的投影H点的y坐标不会有变化,但是x坐标为
沿着y轴平移坐标系
如下图

假设x'yz'是真正的坐标系,沿着y轴平移得到临时坐标系xyz,推导步骤和之前的相同,这里不再赘述,直接贴结果
也就是说当沿着y轴方向移动坐标系的时候,投影H的x坐标不会有变化,y坐标变为
对于空间内任意位置
对于空间内任意位置,我们都可以看成是在z轴上的某一点A(0,0,zA),先经历一次x轴方向的平移(此时投影H的y坐标不变),再经历一次y轴方向的平移(此时投影H的x坐标不变),平移之前点A观察到点G的投影H坐标可表示为
对其进行x轴方向的平移,(此时投影H的y坐标不变),H的坐标可表示为
再对其进行y轴方向的平移,(此时投影H的x坐标不变),H的坐标可表示为
最终结论
从空间内的任意点A(xA,yA,zA)观察空间内的任一点G(xG,yG,zG),它在xy平面内的投影H的坐标为
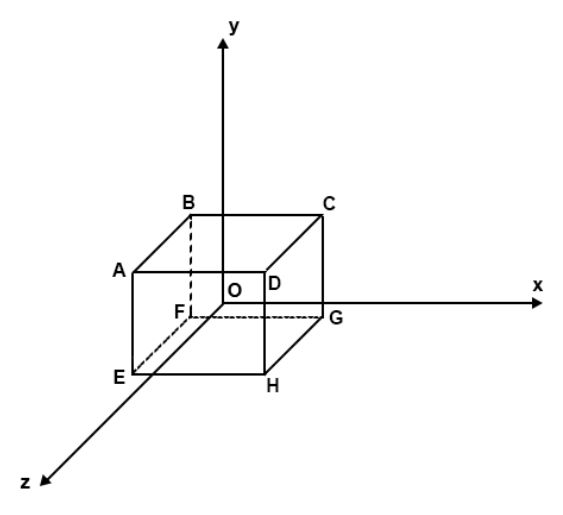
首先我们尝试写一个简单的几何图形

立方体边长为100,则A(-50,50,50),B(-50,50,-50),C(50,50,-50),D(50,50,50),E(-50,-50,50),F(-50,-50,-50),G(50,-50,-50),H(50,-50,50),假定从z轴上某一点(0,0,300)观察
绘制方法也很简单,分别绘制矩形ABCD,矩形EFGH,然后再将AE,BF,CG,DH连线即可,只不过这里的ABCDEFGH点需要换算成投影在三维坐标系xy平面上的点,运用我们之前得出的结论,我们定义一个转换坐标点的函数
        transformCoordinatePoint: function (x, y, z, offsetX = this.canvasWidth / 2, offsetY = this.canvasHeight / 2) {
            return {
                x: (x - this.visual.x) * this.visual.z / (this.visual.z - z) + offsetX,
                y: (y - this.visual.y) * this.visual.z / (this.visual.z - z) + offsetY
            }
        }
然后编写draw函数
        draw: function () {
            let point
            this.ctx.clearRect(0, 0, this.canvasWidth, this.canvasHeight)
            // 绘制矩形ABCD
            this.ctx.beginPath()
            point = this.transformCoordinatePoint(...this.pointMap.A)
            this.ctx.moveTo(point.x, point.y)
            point = this.transformCoordinatePoint(...this.pointMap.B)
            this.ctx.lineTo(point.x, point.y)
            point = this.transformCoordinatePoint(...this.pointMap.C)
            this.ctx.lineTo(point.x, point.y)
            point = this.transformCoordinatePoint(...this.pointMap.D)
            this.ctx.lineTo(point.x, point.y)
            this.ctx.closePath()
            this.ctx.stroke()
            // 绘制矩形EFGH
            this.ctx.beginPath()
            point = this.transformCoordinatePoint(...this.pointMap.E)
            this.ctx.moveTo(point.x, point.y)
            point = this.transformCoordinatePoint(...this.pointMap.F)
            this.ctx.lineTo(point.x, point.y)
            point = this.transformCoordinatePoint(...this.pointMap.G)
            this.ctx.lineTo(point.x, point.y)
            point = this.transformCoordinatePoint(...this.pointMap.H)
            this.ctx.lineTo(point.x, point.y)
            this.ctx.closePath()
            this.ctx.stroke()
            // 绘制直线AE
            this.ctx.beginPath()
            point = this.transformCoordinatePoint(...this.pointMap.A)
            this.ctx.moveTo(point.x, point.y)
            point = this.transformCoordinatePoint(...this.pointMap.E)
            this.ctx.lineTo(point.x, point.y)
            this.ctx.stroke()
            this.ctx.closePath()
            // 绘制直线BF
            this.ctx.beginPath()
            point = this.transformCoordinatePoint(...this.pointMap.B)
            this.ctx.moveTo(point.x, point.y)
            point = this.transformCoordinatePoint(...this.pointMap.F)
            this.ctx.lineTo(point.x, point.y)
            this.ctx.stroke()
            this.ctx.closePath()
            // 绘制直线CD
            this.ctx.beginPath()
            point = this.transformCoordinatePoint(...this.pointMap.C)
            this.ctx.moveTo(point.x, point.y)
            point = this.transformCoordinatePoint(...this.pointMap.G)
            this.ctx.lineTo(point.x, point.y)
            this.ctx.stroke()
            this.ctx.closePath()
            // 绘制直线DH
            this.ctx.beginPath()
            point = this.transformCoordinatePoint(...this.pointMap.D)
            this.ctx.moveTo(point.x, point.y)
            point = this.transformCoordinatePoint(...this.pointMap.H)
            this.ctx.lineTo(point.x, point.y)
            this.ctx.stroke()
            this.ctx.closePath()
        }
查看代码运行结果

似乎是对的,但是有感觉怪怪的,我们尝试将立方体绕着y轴旋转
这里需要另一个数学关系的推导
想象一下从y轴俯视yz平面,这个时候点D的位置关系如下图

这个时候假定D点与x轴的夹角是α,圆的半径为R,将D点绕着y轴旋转β旋转至D'点,这个时候D'与x轴夹角为α+β,此时D'的x坐标为cos(α+β) R,D'的z坐标为sin(α+β)R
回一下中学时候我们学过的三角形倍角公式
D'的x坐标cos(α+β) R=Rcosα cosβ-Rsinα sinβ
D'的z坐标sin(α+β)R=R sinαcosβ+R cosαsinβ
而R sinα就是旋转之前D点的z坐标,Rcosα就是旋转之前D点的x坐标,
D'的x坐标为x cosβ-zsinβ
D'的z坐标为z cosβ+xsinβ
将结论代入到我们的立方体的8个顶点ABCDEFGH中
对于任一点D(xD,yD,zD),其绕y轴旋转β角的时候,它的三维坐标变为(xD cosβ-zDsinβ,yD,zD cosβ+xDsinβ)
转换为代码
    methods: {
        init: function () {
            this.ctx = this.$refs.cube.getContext('2d')
        },
        transformCoordinatePoint: function (x, y, z, offsetX = this.canvasWidth / 2, offsetY = this.canvasHeight / 2) {
            return {
                x: (x - this.visual.x) * this.visual.z / (this.visual.z - z) + offsetX,
                y: (y - this.visual.y) * this.visual.z / (this.visual.z - z) + offsetY
            }
        },
        draw: function () {
            let point
            this.ctx.clearRect(0, 0, this.canvasWidth, this.canvasHeight)
            // 绘制矩形ABCD
            this.ctx.beginPath()
            point = this.transformCoordinatePoint(...this.pointMap.A)
            this.ctx.moveTo(point.x, point.y)
            point = this.transformCoordinatePoint(...this.pointMap.B)
            this.ctx.lineTo(point.x, point.y)
            point = this.transformCoordinatePoint(...this.pointMap.C)
            this.ctx.lineTo(point.x, point.y)
            point = this.transformCoordinatePoint(...this.pointMap.D)
            this.ctx.lineTo(point.x, point.y)
            this.ctx.closePath()
            this.ctx.stroke()
            // 绘制矩形EFGH
            this.ctx.beginPath()
            point = this.transformCoordinatePoint(...this.pointMap.E)
            this.ctx.moveTo(point.x, point.y)
            point = this.transformCoordinatePoint(...this.pointMap.F)
            this.ctx.lineTo(point.x, point.y)
            point = this.transformCoordinatePoint(...this.pointMap.G)
            this.ctx.lineTo(point.x, point.y)
            point = this.transformCoordinatePoint(...this.pointMap.H)
            this.ctx.lineTo(point.x, point.y)
            this.ctx.closePath()
            this.ctx.stroke()
            // 绘制直线AE
            this.ctx.beginPath()
            point = this.transformCoordinatePoint(...this.pointMap.A)
            this.ctx.moveTo(point.x, point.y)
            point = this.transformCoordinatePoint(...this.pointMap.E)
            this.ctx.lineTo(point.x, point.y)
            this.ctx.stroke()
            this.ctx.closePath()
            // 绘制直线BF
            this.ctx.beginPath()
            point = this.transformCoordinatePoint(...this.pointMap.B)
            this.ctx.moveTo(point.x, point.y)
            point = this.transformCoordinatePoint(...this.pointMap.F)
            this.ctx.lineTo(point.x, point.y)
            this.ctx.stroke()
            this.ctx.closePath()
            // 绘制直线CD
            this.ctx.beginPath()
            point = this.transformCoordinatePoint(...this.pointMap.C)
            this.ctx.moveTo(point.x, point.y)
            point = this.transformCoordinatePoint(...this.pointMap.G)
            this.ctx.lineTo(point.x, point.y)
            this.ctx.stroke()
            this.ctx.closePath()
            // 绘制直线DH
            this.ctx.beginPath()
            point = this.transformCoordinatePoint(...this.pointMap.D)
            this.ctx.moveTo(point.x, point.y)
            point = this.transformCoordinatePoint(...this.pointMap.H)
            this.ctx.lineTo(point.x, point.y)
            this.ctx.stroke()
            this.ctx.closePath()
        },
        animationFrame: function () {
            let rotationAngle = 1
            window.requestAnimationFrame(() => {
                for (let key in this.pointMap) {
                    let point = this.pointMap[key]
                    // 保存x,y,z坐标
                    let x = point[0]
                    let y = point[1]
                    let z = point[2]
                    // 变换后的x坐标
                    point[0] = x * Math.cos(rotationAngle / 180 * Math.PI) - z * Math.sin(rotationAngle / 180 * Math.PI)
                    // 绕y轴旋转,y左边不会发生变化
                    point[1] = y
                    // 变换后的z坐标
                    point[2] = z * Math.cos(rotationAngle / 180 * Math.PI) + x * Math.sin(rotationAngle / 180 * Math.PI)
                }
                this.draw()
                this.animationFrame()
            })
        }
    },
    mounted: function () {
        this.init()
        this.animationFrame()
    }
代码运行效果

绘制波浪
波浪是由若干条正弦函数组成的,我们先绘制一条正弦函数
中学数学中,描述一条正弦函数的方程式 y=a*sin(b * x + c) + d,所以我们构造一个类,需要的参数也是a,b,c,d,为了确定函数的起始位置和结束位置,另外需要两个参数start,end
class Line {
    constructor (a, b, c, d, start, end) {
        this.a = a
        this.b = b
        this.c = c
        this.d = d
        this.start = start
        this.end = end
    }
}
export default Line
实际上每条正弦函数曲线并不是真正的连线,而是由于一个个点组成,我们在增加一个参数,确定每个点之间的间距,并在实例化的时候生成这些点,我们这里保存在pointList中
class Line {
    constructor (a, b, c, d, start, end, gap) {
        this.a = a
        this.b = b
        this.c = c
        this.d = d
        this.start = start
        this.end = end
        this.gap = gap
        this.pointList = []
        this.computePointList()
    }
    computePointList () {
        this.pointList = []
        for (let i = this.start; i <= this.end; i = i + this.gap) {
            let x = i
            let y = this.a * Math.sin((this.b * x + this.c) / 180 * Math.PI) + this.d
            this.pointList.push({
                x,
                y
            })
        }
    }
}
export default Line
在页面中,Line实例保存在lineList中,遍历lineList绘制点
看一下代码效果
我们再试着让它动起来,波浪的运动改变的实际上是每个点的纵坐标,只要我们知道每个点距离原点的偏移量,我们就能计算出当前的纵坐标,所以我们在生成点的时候,记录偏移量,我们我们声明一个updatePointList方法用以跟新点的位置
    computePointList () {
        this.pointList = []
        for (let i = this.start; i <= this.end; i = i + this.gap) {
            let x = i
            let y = this.a * Math.sin((this.b * x + this.c) / 180 * Math.PI) + this.d
            let offset = i
            this.pointList.push({
                x,
                y,
                offset
            })
        }
    }
    updatePointList () {
        this.pointList.forEach(item => {
            item.y = this.a * Math.sin((this.b * item.x + this.c + item.offset) / 180 * Math.PI) + this.d
        })
    }
在页面中,我们定义一个变量lineOffset,通过调整它控制line实例的c值(也就是对直线进行平移),并不断地调用之前写好的updatePointList方法,更新点的位置
        animationFrame: function () {
            window.requestAnimationFrame(() => {
                this.lineList.forEach(line => {
                    line.c = this.lineOffset
                    line.updatePointList()
                })
                this.lineOffset = this.lineOffset + 1
                this.draw()
                this.animationFrame()
            })
        }
代码运行效果

但是这个只是二维平面的,想象一下空间中有很多条这样的直线,然后有的直线离屏幕比较近,有的离屏幕比较远,所以我们如果在三维空间中描述直线的话,我们还需要知道三维坐标系中的z坐标,除此之代直线的x,z与之前的相比并无变化
    constructor (a, b, c, d, z, start, end, gap) {
        this.a = a
        this.b = b
        this.c = c
        this.d = d
        this.z = z
        this.start = start
        this.end = end
        this.gap = gap
        this.pointList = []
        this.computePointList()
    }
我们之前已经推导过,对于任一点D(xD,yD,zD),其绕y轴旋转β角的时候,它的三维坐标变为(xDcosβ-zDsinβ,yD,zDcosβ+xDsinβ),想象一下我们直线上的每一个点,其实都是绕着y轴旋转的,旋转之后y轴的坐标不会发生变化,然后看我们原型中声明的updatePointList方法
    updatePointList () {
        this.pointList.forEach(item => {
            item.y = this.a * Math.sin((this.b * item.x + this.c + item.offset) / 180 * Math.PI) + this.d
        })
    }
y轴的坐标我们之前已经写好了,我们运用(xDcosβ-zDsinβ,yD,zDcosβ+xDsinβ)推导每个点旋转β角后的坐标位置
    updatePointList (rotationAngleSpeed) {
        this.pointList.forEach(item => {
            let x = item.x
            let z = item.z
            item.x = x * Math.cos(rotationAngleSpeed / 180 * Math.PI) - z * Math.sin(rotationAngleSpeed / 180 * Math.PI)
            item.z = z * Math.cos(rotationAngleSpeed / 180 * Math.PI) + x * Math.sin(rotationAngleSpeed / 180 * Math.PI)
        })
    }
代码运行效果

但是此时的粒子并没有沿着y轴方向移动,我们将两步结合
    updatePointList (rotationAngleSpeed, visual) {
        this.pointList.forEach(item => {
            let x = item.x
            let y = item.y
            let z = item.z
            item.x = x * Math.cos(rotationAngleSpeed / 180 * Math.PI) - z * Math.sin(rotationAngleSpeed / 180 * Math.PI)
            item.z = z * Math.cos(rotationAngleSpeed / 180 * Math.PI) + x * Math.sin(rotationAngleSpeed / 180 * Math.PI)
            item.y = this.a * Math.sin((this.b * x + this.c + item.offset) / 180 * Math.PI) + this.d
        })
    }
然后我们看一下运行结果

非常的怪异,我们似乎哪里写错了
回过头来看我们的代码,波纹的左右移动实际上是靠从新计算每个点的y坐标实现,而计算y坐标我们用的函数是
item.y = this.a * Math.sin((this.b * x + this.c + item.offset) / 180 * Math.PI) + this.d
但是我们实际上每计算一次item.y的值,我们通过控制this.c来实现平移,所以除了this.c之外,
this.a * Math.sin((this.b * x + this.c + item.offset) / 180 * Math.PI) + this.d
中的 this.a,x(这里的x也就是item.x),this.b,item.offset,this.d都不应该有变化,但是我们代码中的
item.x = x * Math.cos(rotationAngleSpeed / 180 * Math.PI) - z * Math.sin(rotationAngleSpeed / 180 * Math.PI)
却在不停地变化item.x的值,所以我们需要保存一份最开始时时候的x值
    computePointList () {
        this.pointList = []
        for (let i = this.start; i <= this.end; i = i + this.gap) {
            let x = i
            let y = this.a * Math.sin((this.b * x + this.c) / 180 * Math.PI) + this.d
            let offset = i
            this.pointList.push({
                x,
                y,
                z: this.z,
                originX: x,
                offset
            })
        }
    }
    updatePointList (rotationAngleSpeed, visual) {
        this.pointList.forEach(item => {
            let x = item.x
            let y = item.y
            let z = item.z
            item.x = x * Math.cos(rotationAngleSpeed / 180 * Math.PI) - z * Math.sin(rotationAngleSpeed / 180 * Math.PI)
            item.z = z * Math.cos(rotationAngleSpeed / 180 * Math.PI) + x * Math.sin(rotationAngleSpeed / 180 * Math.PI)
            item.y = this.a * Math.sin((this.b * item.originX + this.c + item.offset) / 180 * Math.PI) + this.d
        })
    }
继续看运行效果

虽然代码是对的,但是这个时候的这些点还只是平面上的点,并没有3d效果,我们回到最开始推导出的结论
从空间内的任意点A(xA,yA,zA)观察空间内的任一点G(xG,yG,zG),它在xy平面内的投影H的坐标为
我们顶一个个观察点
    visual: {
        x: 0,
        y: -100,
        z: 1000
    }
并在每次updatePointList方法中调用它,计算这个点在平面xy上的投影位置
        animationFrame: function () {
            window.requestAnimationFrame(() => {
                this.lineList.forEach(line => {
                    line.c = this.lineOffset
                    line.updatePointList(this.rotationAngleSpeed, this.visual)
                })
                this.lineOffset = this.lineOffset + 1
                this.draw()
                this.animationFrame()
            })
        }
在updatePointList函数中,我们拿到传入的视角点visual,并根据视角点计算空间内的点在平面xy上的投影,我们记为(canvasX,canvasY)
    updatePointList (rotationAngleSpeed, visual) {
        this.pointList.forEach(item => {
            let x = item.x
            let y = item.y
            let z = item.z
            item.x = x * Math.cos(rotationAngleSpeed / 180 * Math.PI) - z * Math.sin(rotationAngleSpeed / 180 * Math.PI)
            item.z = z * Math.cos(rotationAngleSpeed / 180 * Math.PI) + x * Math.sin(rotationAngleSpeed / 180 * Math.PI)
            item.y = this.a * Math.sin((this.b * item.originX + this.c + item.offset) / 180 * Math.PI) + this.d
            item.canvasX = (item.x - visual.x) * visual.z / (visual.z - z)
            item.canvasY = (item.y - visual.y) * visual.z / (visual.z - z)
        })
    }
由于我们现在是要绘制投影的坐标,所以我们的draw方法中的绘制圆点的方法需要换成(canvasX,canvasY)
        draw: function () {
            this.ctx.clearRect(0, 0, this.canvasWidth, this.canvasHeight)
            this.lineList.forEach(line => {
                line.pointList.forEach(item => {
                    this.ctx.beginPath()
                    this.ctx.arc(item.canvasX + this.canvasWidth / 2, item.canvasY + this.canvasHeight / 2, 2, 0, 2 * Math.PI)
                    this.ctx.closePath()
                    this.ctx.fill()
                })
            })
        }
运行结果
然后我们试着加入更多的线条
            lineList: [
                new Line(20, 2, 0, 0, -150, -200, 200, 10),
                new Line(20, 2, 0, 0, -120, -200, 200, 10),
                new Line(20, 2, 0, 0, -90, -200, 200, 10),
                new Line(20, 2, 0, 0, -60, -200, 200, 10),
                new Line(20, 2, 0, 0, -30, -200, 200, 10),
                new Line(20, 2, 0, 0, 0, -200, 200, 10),
                new Line(20, 2, 0, 0, 30, -200, 200, 10),
                new Line(20, 2, 0, 0, 60, -200, 200, 10),
                new Line(20, 2, 0, 0, 90, -200, 200, 10),
                new Line(20, 2, 0, 0, 120, -200, 200, 10),
                new Line(20, 2, 0, 0, 150, -200, 200, 10)
            ]
运行结果
我们试着再对每条直线作不同的平移,我们平移直线是通过line构造函数中的参数c控制的,在animationFrame方法中
        animationFrame: function () {
            window.requestAnimationFrame(() => {
                this.lineList.forEach((line, index) => {
                    line.c = this.lineOffset
                    line.updatePointList(this.rotationAngleSpeed, this.visual)
                })
                this.lineOffset = this.lineOffset + 1
                this.draw()
                this.animationFrame()
            })
        }
line.c是被赋值为this.lineOffset,所以我们看到每条直线的偏移量都是一致的,我们试着修改代码,使每条直线的偏移量不一致
        animationFrame: function () {
            window.requestAnimationFrame(() => {
                this.lineList.forEach((line, index) => {
                    line.c = this.lineOffset + index * 30
                    line.updatePointList(this.rotationAngleSpeed, this.visual)
                })
                this.lineOffset = this.lineOffset + 1
                this.draw()
                this.animationFrame()
            })
        }
代码运行结果
实际上我们还忽略了一个点,那就是点的远近大小关系,真实情况应该是离我们屏幕较近的点,看起来更大,离屏更远的点,看起来更小,而离屏幕的距离不就是z的坐标吗
我们回到最开始推论的那副图
在A点观察直线DB在平面xy内的投影OC,由相似三角形可知
推导得
所以假定小圆点的半斤是R,站在A(0,0,)点观测小圆点位于平面xy上投影的半径为
我们将draw方法中的代码做修改
        draw: function () {
            this.ctx.clearRect(0, 0, this.canvasWidth, this.canvasHeight)
            this.lineList.forEach(line => {
                line.pointList.forEach(item => {
                    this.ctx.beginPath()
                    // 暂且假定小圆点的原始半径是2,则投影半径可表示为
                    let pointSize = 2 * this.visual.z / (this.visual.z - item.z)
                    this.ctx.arc(item.canvasX + this.canvasWidth / 2, item.canvasY + this.canvasHeight / 2, pointSize, 0, 2 * Math.PI)
                    this.ctx.closePath()
                    this.ctx.fill()
                })
            })
        }
运行效果
我们不断调整实例化时候line的各个参数,最终实现效果
到此,请记住这篇文章最重要的一个结论
从空间内的任意点A(xA,yA,zA)观察空间内的任一点G(xG,yG,zG),它在xy平面内的投影H的坐标为
如果以后还有与canvas绘制3d图形有关的文章,这个结论会一直用到
写在最后:刚开始工作那会,真的小白一个(虽然现在水平也不咋地),甚至不知道canvas为何物,当时看到有个网站的首页背景就有一个粒子拼接成的波浪效果的背景(和上面图片的demo差不多),觉得非常神奇。当时想不明白是怎么做到的,工作了一段时间之后,因为很多ui设计的效果css实现不了,所以被逼无奈去学着去用canvas,到最后觉得很多以前看似很神奇的ui效果,也并没有那么神秘了。之前一次做项目用到了three.js,一开始里面的很多参数我搞不明白是怎么回事,后面了解到每个参数的意义,three.js中场景,相机的概念之后,重新回过头来思考波浪效果的canvas,一下就想明白了。之前有想过,用本文最后得到的那个结论,在canvas上绘制一个3d的魔方,并且实现和真实魔方一样的旋转操作。但是做到后面发现,我的数学知识并不够。。。很多立体坐标的变换的东西,高中并没有教过,大学高数中也没有提到。经常就是,半天不知道代码那里写错了,搞到最后发现是自己的数学推导那边就已经错了,所以数学推导再变成代码,错的非常离谱了。数学在canvas这种以像素为单位的h5元素中,非常的有用。工作久了也有挺老油条的了,所以希望自己以后也能稍微勤奋点吧,做条有梦想的咸鱼