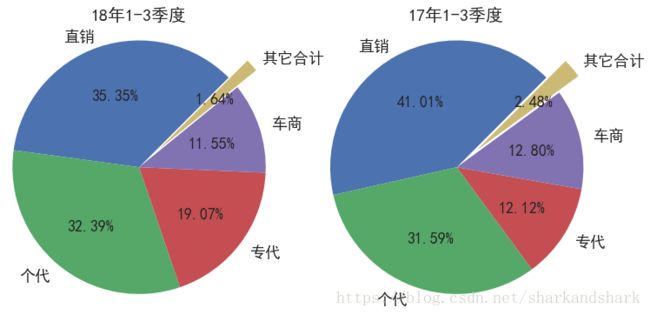
方法一:axs画子图
import seaborn as sns
import matplotlib
import matplotlib.pyplot as plt

sns.set_style("whitegrid")
matplotlib.rcParams['font.sans-serif'] = ['SimHei']
matplotlib.rcParams['font.family']='sans-serif'

matplotlib.rcParams['axes.unicode_minus'] = False
matplotlib.fontsize='20'

#第一个方法生成两个子图,这里axs是一个列表

fig, axs = plt.subplots(1, 2, figsize=(12,6), sharey=True)#一行两列的子图分布

labels = list(t5.index)
sizes = list(t5['18年结构占比'])
explode = (0.0,0.0,0.0, 0.0,0.2)  # only "explode" the 2nd slice (i.e. 'Hogs')


axs[0].pie(sizes, explode=explode, labels=labels, autopct='%1.2f%%',
        shadow=False, startangle=45,textprops={'fontsize': 18})
axs[0].set_title('18年1-3季度',fontsize='20')
axs[0].axis('equal')

labels = list(t5.index)
sizes = list(t5['17年结构占比'])
explode = (0.0,0.0,0.0, 0.0,0.2)  # only "explode" the 2nd slice (i.e. 'Hogs')


axs[1].pie(sizes, explode=explode, labels=labels, autopct='%1.2f%%',
        shadow=False, startangle=45,textprops={'fontsize': 18})
axs[1].set_title('17年1-3季度',fontsize='20')
axs[1].axis('equal')  # Equal aspect ratio ensures that pie is drawn as a circle.

plt.savefig('e:/tj/month/fx1809/渠道结构饼.png',dpi=600,bbox_inches = 'tight')

plt.show()
axs效果

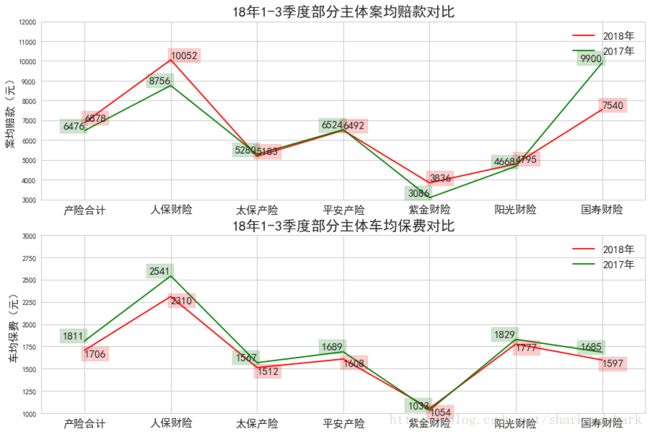
方法二:subplot画子图
import seaborn as sns
import matplotlib
import matplotlib.pyplot as plt

sns.set_style("whitegrid")
matplotlib.rcParams['font.sans-serif'] = ['SimHei']
matplotlib.rcParams['font.family']='sans-serif'
#解决负号'-'显示为方块的问题
matplotlib.rcParams['axes.unicode_minus'] = False
matplotlib.fontsize='20'

#plt.subplot(121)
fig, axs = plt.subplots(2, 1, figsize=(15,10), sharey=True)

x = range(len(ct.index))
y1 = ct['案均赔款(元)2018']
y2= ct['案均赔款(元)2017']

#使用subplot
plt.subplot(2,1,1) #两行一列,第一个图
plt.plot(x,y1,'r')
plt.plot(x,y2,'g')
plt.ylim(3000,12000)
plt.xlim(-0.5,6.5)
plt.xticks(x, ct.index,fontsize='15')
plt.ylabel('案均赔款(元)',fontsize='15')
plt.title('18年1-3季度部分主体案均赔款对比',fontsize='20')
plt.legend(['2018年','2017年'],fontsize='15')
for x,y,z  in zip(x,y1,y2):
        plt.text(x, y+5, str(int(y)), ha='left', va='bottom', fontsize=15,rotation=0,bbox=dict(facecolor='red', alpha=0.2))
        plt.text(x, z+5, str(int(z)), ha='right', va='bottom', fontsize=15,rotation=0,bbox=dict(facecolor='g', alpha=0.2))


x = range(len(ct.index))
y1 = ct['车均保费(元)2018']
y2= ct['车均保费(元)2017']

#两行一列的第二个图
plt.subplot(2,1,2)
plt.plot(x,y1,'r')
plt.plot(x,y2,'g')
plt.ylim(1000,3000)
plt.xlim(-0.5,6.5)
plt.xticks(x, ct.index,fontsize='15')
plt.ylabel('车均保费(元)',fontsize='15')
plt.title('18年1-3季度部分主体车均保费对比',fontsize='20')
plt.legend(['2018年','2017年'],fontsize='15')
for x,y,z  in zip(x,y1,y2):
        plt.text(x, y+5, str(int(y)), ha='left', va='top', fontsize=15,rotation=0,bbox=dict(facecolor='red', alpha=0.2))
        plt.text(x, z+5, str(int(z)), ha='right', va='bottom', fontsize=15,rotation=0,bbox=dict(facecolor='g', alpha=0.2))


plt.savefig('e:/tj/month/fx1809/车均案均.png',dpi=600,bbox_inches = 'tight')
plt.show()
subplot效果


