爬山算法与模拟退火算法
爬山算法,是一种局部贪心的最优算法. 该算法的主要思想是:每次拿相邻点与当前点进行比对,取两者中较优者,作为爬坡的下一步.
可分为:
- 首选爬山算法
依次寻找该点x的邻近点中首次出现的比点x值高的点,将该点作为爬山的点. 依次循环,直至该点的邻近点中不再有比其大的点. - 最陡爬山算法
最陡爬山算法是在首选爬山算法上的一种改良,它规定每次选取邻近点值最大的那个点作为爬山的点.
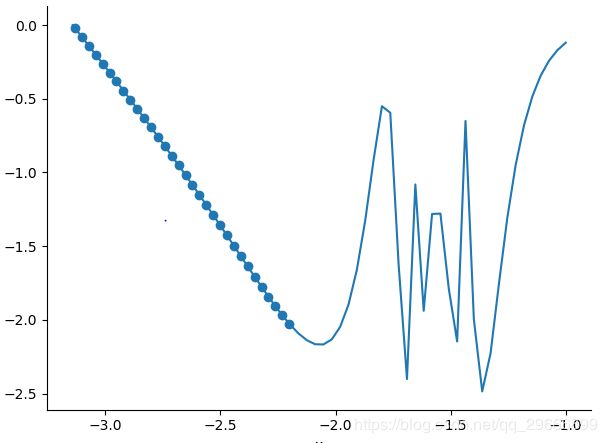
下面以函数:y = tan(sin(x)) - sin(tan(x))为例,求解局部最大值。
import random
import matplotlib.pyplot as plt
import numpy as np


class HillClimbing(object):
    """爬山算法"""
    def __init__(self):
        # x的定义域
        self.x_range = np.array([-np.pi, -1])
        # 画图所需的x, y数组
        self.x = np.linspace(start=self.x_range[0], stop=self.x_range[1], num=60)
        self.y = np.tan(np.sin(self.x)) - np.sin(np.tan(self.x))
        # 随机产生的第一个值
        self.first_value = random.uniform(-3, -1)
        # figure 1
        self.fig1 = plt.figure(num='fig1')
        # 爬山路径
        self.path = {self.first_value: self.evaluate(self.first_value)}

    def evaluate(self, value):
        """计算结果"""
        result = np.tan(np.sin(value)) - np.sin(np.tan(value))
        return result

    def creat_values(self, value, offset):
        """产生给定坐标的周围坐标"""
        values = []
        if -np.pi < value - offset < -1:
            values.append(value - offset)
        else:
            values.append(None)
        if -np.pi < value + offset < -1:
            values.append(value + offset)
        else:
            values.append(None)
        return values

    def record_path(self, value, result):
        """记录路径,将每一步添加到路径列表中"""
        self.path[value] = result

    def draw_path(self):
        """画出路径"""
        plt.figure(num='fig1')
        keys = []
        values = []
        print(self.path)
        for k, v in self.path.items():
            keys.append(k)
            values.append(v)
        plt.scatter(x=keys, y=values)

    def start_caculate(self):
        # 当前x值等于第一个随机产生的x值
        current_value = self.first_value
        while True:
            # 循环结束标志
            flag = True
            # 计算当前结果
            current_result = self.evaluate(current_value)
            # 将当前结果作为最好的结果
            best_result = current_result
            # 计算当前值的周围值
            all_values = self.creat_values(current_value, 0.03)
            # 对周围坐标计算其结果,并选出最优解
            for each_value in all_values:
                if each_value is not None:
                    result = self.evaluate(each_value)
                    if result > current_result:
                        # 记录路径
                        self.record_path(each_value, result)
                        # 更新当前值current_value,current_result, best_result
                        current_value = each_value
                        current_result = result
                        best_result = result
                        flag = False
            if flag:
                break

        print('x:', current_value, 'best result:', best_result)

    def show(self):
        plt.figure(num='fig1')
        plt.xlabel('x')
        plt.ylabel('sin(x)')

        axes = plt.gca()
        axes.spines['right'].set_color('none')
        axes.spines['top'].set_color('none')

        plt.plot(self.x, self.y)
        self.draw_path()
        plt.show()


if __name__ == '__main__':
    hill = HillClimbing()
    hill.start_caculate()
    hill.show()
x: -3.13 best result: -0.02
{-2.20: -2.02, -2.23: -1.96, -2.26: -1.90, -2.29: -1.84, -2.32: -1.77, -2.35: -1.70, -2.38: -1.63, -2.41: -1.56, -2.44: -1.49, -2.47: -1.42, -2.50: -1.35, -2.53: -1.28, -2.56: -1.22, -2.59: -1.15, -2.62: -1.08, -2.65: -1.01, -2.68: -0.95, -2.71: -0.88, -2.74: -0.82, -2.77: -0.75, -2.80: -0.69, -2.83: -0.63, -2.86: -0.56, -2.89: -0.50, -2.92: -0.44, -2.95: -0.38, -2.98: -0.32, -3.0: -0.26, -3.04: -0.20, -3.07: -0.14, -3.10: -0.08, -3.13: -0.02}
模拟退火算法
- 算法的提出
模拟退火算法最早的思想由Metropolis等(1953)提出,1983年Kirkpatrick等将其应用于组合优化。 - 算法的目的
解决NP复杂性问题;
克服优化过程陷入局部极小;
克服初值依赖性。
Boltzman概率分布告诉我们:
(1)在同一个温度,分子停留在能量小状态的概率大于停留在能量大状态的概率
(2)温度越高,不同能量状态对应的概率相差越小;温度足够高时,各状态对应概率基本相同。
(3)随着温度的下降,能量最低状态对应概率越来越大;温度趋于0时,其状态趋于1
Metropolis准则(1953)——以概率接受新状态
- 若在温度T,当前状态i → 新状态j
- 若Ej
- 否则,若概率 p=exp[-(Ej-Ei)/kT] 大于[0,1)区间的随机数,则仍接受状态 j 为当前状态;若不成立则保留状态 i 为当前状态。
其中k是波尔兹曼常数,值为k=1.3806488(13)×10−23,exp表示自然指数,且-(Ej-Ei)<0。因此[-(Ej-Ei)/kT]<0,所以p的取值范围是(0,1)。满足概率密度函数的定义。其实这条公式更直观意思就是:温度越高,出现一次能量差为p(dE)的降温的概率就越大;温度越低,则出现降温的概率就越小。
模拟退火算法的基本步骤:
1. 初始化,给定初始温度T, 最低温度Tmin, 初始状态x, 并计算出初始解result,同一温度下迭代次数N;
2. 产生新的状态x_new,并产生新解result_new
3. 计算函数差值Δf=f(x_new)−f(x)
4. 若Δf<=0,则接受此新解作为当前解
5. 若Δf>0,则以概率p=exp(−Δf/(kT))大于[0,1)区间的随机数接受此新解作为当前解
6. 对当前温度T迭代N次
7. 若满足终止条件则输出当前解为最优解,结束算法。否则降温,继续迭代。
以如下函数为例:
import random
import matplotlib.pyplot as plt
import numpy as np
from mpl_toolkits.mplot3d import Axes3D

class SimulatedAnnealing(object):
    def __init__(self):
        # x,y的定义域
        self.x_range = np.array([-2, 4])
        self.y_range = np.array([-2, 4])

        # 画图所需的x, y数组
        self.x = np.arange(-2, 4, 0.1)
        self.y = np.arange(-2, 4, 0.1)
        self.x, self.y = np.meshgrid(self.x, self.y)
        self.z = self.evaluate(self.x, self.y)

        # 随机登山点
        len_x = len(self.x)
        len_y = len(self.y)
        self.current_x = self.x[0][random.randint(0, len_x - 1)]
        self.current_y = self.y[random.randint(0, len_y - 1)][0]
        self.current_result = self.evaluate(self.current_x, self.current_y)
        print('first x:', self.current_x)
        print('first y:', self.current_y)
	# 初始化温度等值
        self.T = 100
        self.Tmin = 1e-10
        self.N = 10

        # figure 1
        self.fig1 = plt.figure(num='fig1')
        self.ax = Axes3D(self.fig1)
        # 爬山路径
        self.path = {(self.current_x, self.current_y): self.current_result}

    def evaluate(self, x, y, x_move=1.7, y_move=1.7):
        """计算结果"""
        def mul(x, y, alis=1):
            return alis * np.exp(-(x * x + y * y))
        return mul(x, y) + mul(x - x_move, y - y_move, 2)

    def record_path(self, x, y, z):
        """记录路径,将每一步添加到路径列表中"""
        self.path[(x, y)] = z

    def draw_path(self):
        """画出路径"""
        x = []
        y = []
        z = []
        for k, v in self.path.items():
            x_value, y_value = k
            x.append(x_value)
            y.append(y_value)
            z.append(v)
        self.ax.scatter(xs=x, ys=y, zs=z, color='r')

    def start_caculate(self):
        """计算最值"""
        while self.T > self.Tmin:
            # 温度T下循环N次
            for i in range(self.N):
                # 随机产生一个新的邻近点
                # 说明: 温度越高幅度邻近点跳跃的幅度越大
                x_new = self.current_x + (random.random() * 2 - 1) * self.T
                y_new = self.current_y + (random.random() * 2 - 1) * self.T
                # 判断产生的点是否在定义域内
                if 4 > x_new >= -2 and 4 > y_new >= -2:
                    # 新的结果
                    result_new = self.evaluate(x_new, y_new)
                    # 判断Δf的正负
                    if result_new - self.current_result > 0:
                        # 为正则接受为新解
                        self.record_path(x_new, y_new, result_new)
                        self.current_x = x_new
                        self.current_y = y_new
                        self.current_result = result_new
                    else:
                        # 为负则计算概率
                        p = 1.0 / (1.0 + np.exp(-(result_new - self.current_result) / self.T))
                        r = np.random.uniform(low=0, high=1)
                        # 判断是否可以接受为新解
                        if r < p:
                            self.record_path(x_new, y_new, result_new)
                            self.current_x = x_new
                            self.current_y = y_new
                            self.current_result = result_new
            # 降温
            self.T *= 0.95
        print('max :', self.current_x, self.current_y, self.current_result)

    def show(self):
        self.ax.plot_surface(self.x, self.y, self.z, rstride=1, cstride=1, color='b')
        self.ax.set_xlabel('x label', color='r')
        self.ax.set_ylabel('y label', color='g')
        self.ax.set_zlabel('z label', color='b')
        self.draw_path()
        plt.show()

if __name__ == '__main__':
    sa = SimulatedAnnealing()
    sa.start_caculate()
    sa.show()
first x: 3.0000000000000044 first y: 3.7000000000000046
max :1.6973307001008588 1.6973306942718158 2.0031167460631685

参考:https://www.cnblogs.com/gongxijun/p/5873643.html
https://blog.csdn.net/zhouzi2018/article/details/82118673
