kaggle--房价预测模型
kaggle中的竞赛是练习数据分析的好地方,最近我也尝试着入门kaggle数据分析,并把自己的想法写出来,排名不好,大家有想法的可以一起讨论哈!
#导入各种模块,用的是增强决策树算法和梯度回归算法
import numpy as np
import pandas as pd
from sklearn import cross_validation
from sklearn import preprocessing
from sklearn.tree import DecisionTreeRegressor
from sklearn.ensemble import AdaBoostRegressor
from sklearn.metrics import mean_squared_error, explained_variance_score
from sklearn.preprocessing import MinMaxScaler
from sklearn.ensemble import GradientBoostingRegressor

#读入数据
train_file_path = r'E:/study/python/keggle/House/train.csv'
test_file_path = r'E:/study/python/keggle/House/test.csv'
train_df = pd.read_csv(train_file_path)
test_df = pd.read_csv(test_file_path)
#数据整理
train_clean_df = train_df.drop(['Id','Alley','PoolQC','Fence','MiscFeature','FireplaceQu'],axis=1) #将数据中空值率高的列删除掉
#用平均值填充缺LotFrontage的失值
LotFrontage_mean = train_df['LotFrontage'].mean()
LotFrontage = train_clean_df['LotFrontage'].fillna(LotFrontage_mean)
train_clean_df['LotFrontage'] = LotFrontage
#用向前填充的方式填充其他缺失值
train_clean_df = train_clean_df.fillna(method='ffill')
#train_clean_df = train_clean_df[train_clean_df['SalePrice'] < 700000] #这一步本来是用来删除SalePrice异常值所在的行的,但效果不明显
#用同样的方式处理测试数据
test_clean_df = test_df.drop(['Id','Alley','PoolQC','Fence','MiscFeature','FireplaceQu'],axis=1)
LotFrontage_mean = test_df['LotFrontage'].mean()
LotFrontage = test_clean_df['LotFrontage'].fillna(LotFrontage_mean)
test_clean_df['LotFrontage'] = LotFrontage
test_clean_df = test_clean_df.fillna(method='ffill')

#训练数据数组化
x = np.array(train_clean_df.iloc[:,:-1])
y = np.log1p(np.array(train_clean_df['SalePrice'])) #用np.log1p处理

#将标签数据数值化
label_encoder = []
x_encoded = np.empty(x.shape)
for i,item in enumerate(x[0]):
    if isinstance(item, (int, float)):
        x_encoded[:,i] = x[:,i]
    else:
        label_encoder.append(preprocessing.LabelEncoder()) #只有遇到字符串才生成preprocessing.LabelEncoder()对象
        x_encoded[:,i] = label_encoder[-1].fit_transform(x[:,i])
x = x_encoded
#x标准化,范围0~1
scaler = MinMaxScaler(feature_range=(0, 1))
scaler.fit(x)
x = scaler.transform(x)

#将train数据分成模型训练数据集和验证数据集
x_train, x_test, y_train, y_test = cross_validation.train_test_split(x, y,
test_size=0.25, random_state=5)

#使用梯度回归算法
gbr_regressor = GradientBoostingRegressor()
gbr_regressor.fit(x_train, y_train)
y_pred_gbr = gbr_regressor.predict(x_test)
mse = mean_squared_error(y_test, y_pred_gbr)
evs = explained_variance_score(y_test, y_pred_gbr)
print("\n#### GradientBoostingRegressor performance ####")
print("Root mean squared error =", round(np.sqrt(mse), 2))
print ("Explained variance score =", round(evs, 2))

#使用增强的决策树算法
ab_regressor = AdaBoostRegressor(DecisionTreeRegressor(max_depth=10), n_estimators=200, random_state=7)
ab_regressor.fit(x_train, y_train)
y_pred_ab = ab_regressor.predict(x_test)
mse = mean_squared_error(y_test, y_pred_ab)
evs = explained_variance_score(y_test, y_pred_ab)

print("\n#### AdaBoost performance ####")
print("Root mean squared error =", round(np.sqrt(mse), 2))
print ("Explained variance score =", round(evs, 2))
其实在使用梯度回归算法的时候,使用的是默认参数,我对其进行了调参,但效果没有默认参数效果好,代码如下,也有可能是我用的方法不对,
#固定max_depth,来寻找最优的n_estimators
import matplotlib.pyplot as plt
from sklearn.learning_curve import validation_curve
gbr_regressor = GradientBoostingRegressor(max_depth=10)
parameter_grid = np.linspace(25, 800, 8).astype(int)
train_scores, validation_scores = validation_curve(gbr_regressor, x_train, y_train, "n_estimators", parameter_grid, cv=5)

plt.figure()
plt.plot(parameter_grid, 100*np.average(train_scores, axis=1), color='black')
plt.plot(parameter_grid, 100*np.average(validation_scores, axis=1), color='red')
plt.title('curve')
plt.xlabel('n_estimators')
plt.ylabel('Accuracy')
plt.show()
输出图像:
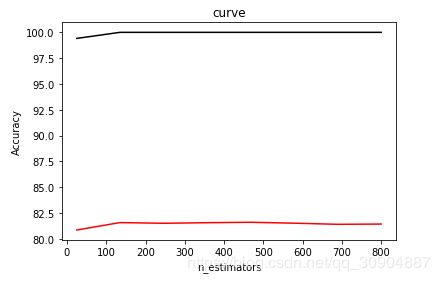
但是实际使用效果不好,所以最后没有用参数。