kaggle-House Prices: Advanced Regression Techniques房价预测
比赛介绍:
刚上研究生的时候就听过kaggle这个网站,但当时看它全是英文版的网站,就没太放在心上,因为英文水平确实是不咋地,最近才发现,kaggle确实是一个非常好的学习网站,因为它的用户量非常大,并且还有很多用户分享的内核-kernels,我们可以从中获得很多经验-如果做一个完成的项目,有哪些步骤,预处理、特征工程、建立模型等等,这是本人在kaggle上玩的第二个入门项目,嘻嘻,下面正是开始讲解,文笔有限,敬请见谅,欢迎指正:
首先放上比赛地址:https://www.kaggle.com/c/house-prices-advanced-regression-techniques
简介:给定训练集和测试集,训练集总共有房子的很多特征(面积,房价数等等),并且还有房价,然后通过训练集去建立模型预测测试集中的房子的房价。
特征说明:
SalePrice - the property's sale price in dollars. This is the target variable that you're trying to predict.:房价
MSSubClass: The building class:建筑种类(20,30,40等等,也不知道啥意思)
MSZoning: The general zoning classification:分区分类(5类:RH,C(all),RL等等)
LotFrontage: Linear feet of street connected to property:与财产相连的街道的直线尺(20,30,234+NA)
LotArea: Lot size in square feet:面积(8450,11200...)
Street: Type of road access:道路通道类别(Grvi Pave两类)
Alley: Type of alley access:通道类型(Grvi Pave两类+NA)
LotShape: General shape of property:财产形状(4类:IR1,IR2...)
LandContour: Flatness of the property:平坦性(4类:Lvl...)
Utilities: Type of utilities available可用的工具种类(2类:Allpub...)
LotConfig: Lot configuration配置(5类:corner...)
LandSlope: Slope of property倾斜属性(3类:Gtl...)
Neighborhood: Physical locations within Ames city limits埃姆斯市范围内的物理位置:好多类(dlegg...)
Condition1: Proximity to main road or railroad靠近主干路或铁路(Norm,Alidg...)
Condition2: Proximity to main road or railroad (if a second is present)靠近主干路或铁路(如果有第二条)
BldgType: Type of dwelling:住宅类型(5类)
HouseStyle: Style of dwelling:住宅风格(7类左右)
OverallQual: Overall material and finish quality整体材料和成品质量:1-10之间
OverallCond: Overall condition rating总体状况评级:1-9之间
YearBuilt: Original construction dateYear建于某某年:2031
RemodAdd: Remodel date:改变日期2001
RoofStyle: Type of roof:屋顶风格(5类:Gable...)
RoofMatl: Roof material:屋顶材料(8类左右)
Exterior1st: Exterior covering on house房屋外墙:(好几类呢也)
Exterior2nd: Exterior covering on house (if more than one material):(第二种材料,多了个None,有些就一种材料)
MasVnrType: Masonry veneer type表层砌体类型:(4类+None)
MasVnrArea: Masonry veneer area in square feet:砖石面积:(0,各种数字1,300,还有NA)
ExterQual: Exterior material quality外部材质:(4类,四个看不懂的英文缩写)
ExterCond: Present condition of the material on the exterior外观材料的现状:由高到低,5类
Foundation: Type of foundation地基类型:几类看不懂的类型(wood...)
BsmtQual: Height of the basement地下室的高度:由高到低:5类
BsmtCond: General condition of the basement地下室现状:同上,5类
BsmtExposure: Walkout or garden level basement walls户外或花园水平的地下室墙壁,同上,5类
BsmtFinType1: Quality of basement finished area地下室装修区域质量:好几类
BsmtFinSF1: Type 1 finished square feet:1型面积
BsmtFinType2: Quality of second finished area (if present):第二种质量
BsmtFinSF2: Type 2 finished square feet:2型面积
BsmtUnfSF: Unfinished square feet of basement area未完工的地下室面积
TotalBsmtSF: Total square feet of basement area地下面积的总面积
Heating: Type of heating:加热方式:好几种
HeatingQC: Heating quality and condition加热质量及条件:5种
CentralAir: Central air conditioning中央空调(N/Y)有或者没有yes or no
Electrical: Electrical system电气系统:好几种
1stFlrSF: First Floor square feet第一层面积
2ndFlrSF: Second floor square feet第二层面积
LowQualFinSF: Low quality finished square feet (all floors)低品质成品平方英尺(所有楼层):各种数字
GrLivArea: Above grade (ground) living area square feet地面以上居住面积平方英尺
BsmtFullBath: Basement full bathrooms地下室全浴室(0-3)
BsmtHalfBath: Basement half bathrooms半地下室卫生间(0-2)
FullBath: Full bathrooms above grade高档全浴室(0-3)
HalfBath: Half baths above grade半浴缸以上(0-2)
Bedroom: Number of bedrooms above basement level地下室以上的卧室数:0-8
Kitchen: Number of kitchens厨房数量
KitchenQual: Kitchen quality厨房质量:5个
TotRmsAbvGrd: Total rooms above grade (does not include bathrooms)房间总数(不含卫生间)
Functional: Home functionality rating家庭功能评级(min,mod...)
Fireplaces: Number of fireplaces壁炉数量
FireplaceQu: Fireplace quality壁炉质量
GarageType: Garage location车库位置(好几类)
GarageYrBlt: Year garage was built车库建造年份
GarageFinish: Interior finish of the garage车库内部装修
GarageCars: Size of garage in car capacity车库容量的大小0-4
GarageArea: Size of garage in square feet车库面积
GarageQual: Garage quality车库质量
GarageCond: Garage condition车库条件,好几类
PavedDrive: Paved driveway道路车道(N/P/Y)
WoodDeckSF: Wood deck area in square feet木甲板面积
OpenPorchSF: Open porch area in square feet开放式门廊面积(平方英尺)
EnclosedPorch: Enclosed porch area in square feet3:3英尺的封闭式玄关区域
SsnPorch: Three season porch area in square feet三季门廊面积平方英尺
ScreenPorch: Screen porch area in square feet屏风门廊面积(平方英尺)
PoolArea: Pool area in square feet游泳池面积(平方英尺)
PoolQC: Pool quality泳池质量
Fence: Fence quality栅栏质量
MiscFeature: Miscellaneous feature not covered in other categories其他类别中未涉及的杂项功能
MiscVal: $Value of miscellaneous feature杂项特征值0-15500
MoSold: Month
SoldYrSold: Year
SoldSaleType: Type of sale:看不懂的好几类
SaleCondition: Condition of sale销售质量
1. 数据预处理
导入相应库:
import numpy as np
import pandas as pd
import matplotlib.pyplot as plt#三大基本库
导入数据:
train=pd.read_csv("data/train.csv")
test=pd.read_csv("data/test.csv")查看训练集的前5行:
print(train.head(5))发现中间省略了很多列,输入以下代码,显示全部列:
pd.set_option("display.max_columns",None)
pd.set_option("display.max_rows",None)
pd.set_option("max_colwidth",100)
查看训练集和测试集的形状:
print(train.shape,test.shape) #(1460, 81) (1459, 80)可知训练集有1460行,81个特征;测试集有1459行,有80个特征,除了价格,这正是咱们要预测的特征。
对ID列的处理:
train_Id=train.Id
test_Id=test.Id #保存ID

#删除ID列
train.drop("Id",axis=1,inplace=True)
test.drop("Id",axis=1,inplace=True)

print(train.shape,test.shape) #(1460, 80) (1459, 79)
2.数据可视化
可视化面积(GrLivArea)和销售价格(SalePrice)间的关系
#data processing
plt.figure(1)
plt.scatter(x=train['GrLivArea'],y=train['SalePrice'])
plt.ylabel('SalePrice',fontsize=13)
plt.xlabel("GrLivArea",fontsize=13)
plt.show()
从上图得知:右下角的两个值为异常值,面积很大,但是价格却很低,不符合总体规律,可能是什么农场之类的,因此我们应该去掉这两行数据。
train=train.drop(train[(train['GrLivArea']>4000)&(train['SalePrice']<300000)].index)查看销售价格(SalePrice)的分布情况
import seaborn as sns
color =sns.color_palette()
sns.set_style('darkgrid')

from scipy import stats
from scipy.stats import norm,skew


plt.figure(2)
sns.distplot(train['SalePrice'],fit=norm)

(mu, sigma) = norm.fit(train['SalePrice'])
plt.legend(['Normal dist. ($\mu=$ {:.2f} and $\sigma=$ {:.2f} )'.format(mu, sigma)],
            loc='best')
plt.ylabel('Frequency')
plt.title('SalePrice distribution')
plt.show()

#skew:偏度 =0正太分布 >0正偏
#kurt:峰度 >0尖顶峰,<0平顶峰
print("skewness: %f" % train['SalePrice'].skew())
print("kurtosis: %f" % train['SalePrice'].kurt())
#skewness: 1.882876
#kurtosis: 6.536282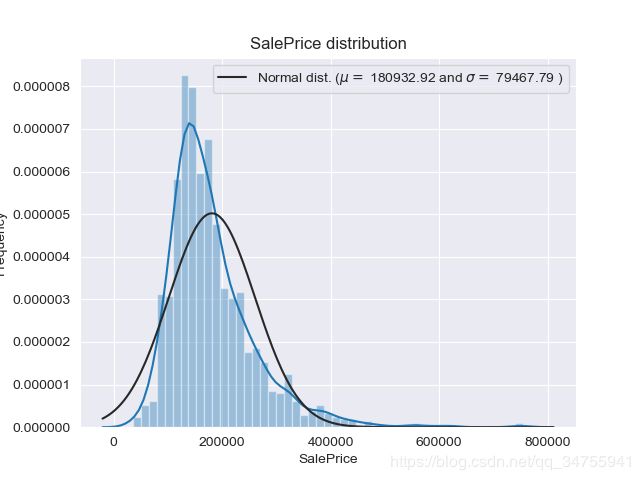
plt.figure(3)
res = stats.probplot(train['SalePrice'], plot=plt)
plt.show()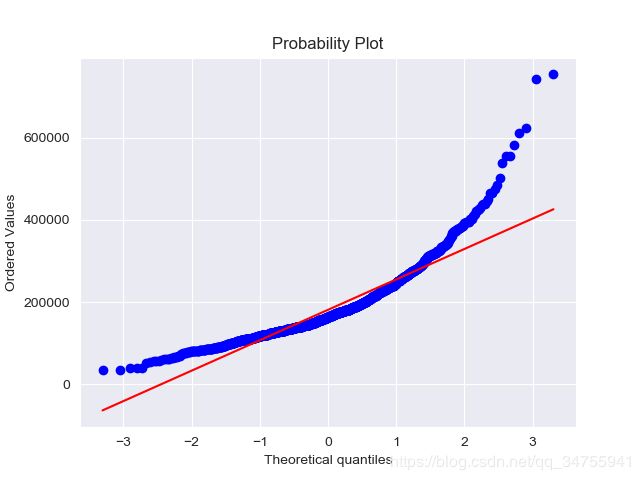
对SalePrice取对数,让其符合正太分布:
train['SalePrice']=np.log1p(train['SalePrice'])
plt.figure(4)
sns.distplot(train['SalePrice'],fit=norm)
(mu, sigma) = norm.fit(train['SalePrice'])
plt.legend(['Normal dist. ($\mu=$ {:.2f} and $\sigma=$ {:.2f} )'.format(mu, sigma)],
            loc='best')
plt.ylabel('Frequency')
plt.title('SalePrice distribution')
plt.show()
可视化特征之间的相关性:
#saleprice correlation matrix
#找与price最相关的10个量
k=10
#10个cloumn names
cols=corrmat.nlargest(k,'SalePrice')['SalePrice'].index
cm=np.corrcoef(train[cols].values.T)
print(cm)#一个二维矩阵
sns.set(font_scale=1.25)
hm = sns.heatmap(cm, cbar=True, annot=True, square=True, fmt='.2f',
                 annot_kws={'size': 10}, yticklabels=cols.values, xticklabels=cols.values)
plt.show()
由上图可知:与价格相关性最大的10个变量分别是:如上图所示的10个坐标值。
3. 缺失值的处理
缺失值概览:
#missing data
#对每一列总共有多少个缺失值进行排序:total
total=train.isnull().sum().sort_values(ascending=False)
#缺失值占总缺失的总数
percent=(train.isnull().sum()/train.isnull().count()).sort_values(ascending=False)
missing_data=pd.concat([total,percent],axis=1,keys=['Total','Percent'])
print(missing_data.head(20))
结果如下:
Total Percent
PoolQC 1453 0.995205
MiscFeature 1406 0.963014
Alley 1369 0.937671
Fence 1179 0.807534
FireplaceQu 690 0.472603
LotFrontage 259 0.177397
GarageCond 81 0.055479
GarageType 81 0.055479
GarageYrBlt 81 0.055479
GarageFinish 81 0.055479
GarageQual 81 0.055479
BsmtExposure 38 0.026027
BsmtFinType2 38 0.026027
BsmtFinType1 37 0.025342
BsmtCond 37 0.025342
BsmtQual 37 0.025342
MasVnrArea 8 0.005479
MasVnrType 8 0.005479
Electrical 1 0.000685
Utilities 0 0.000000
处理一:
根据上述结果,发现Electrical这一列只有一个缺失值,所以删除有缺失值的这一行,然后删除>=8的列
#dealing with missing data
train=train.drop((missing_data[missing_data['Total']>1]).index,1)
train=train.drop(train.loc[train['Electrical'].isnull()].index)
print(train.isnull().sum().max()) #输出为0,意味着没有缺失值了
处理二:
首先合并train和test,然后删除SalePrice这一列:
ntrain=train.shape[0] #列数
ntest=test.shape[0] #列数
y_train=train.SalePrice.values
all_data=pd.concat((train,test)).reset_index(drop=True)
print(all_data.shape) #合并train和test
all_data.drop(['SalePrice'],axis=1,inplace=True)
print(all_data.shape) #删除SalePrice
#imputing missing values
all_data['PoolQC']=all_data['PoolQC'].fillna('None')
all_data["MiscFeature"] = all_data["MiscFeature"].fillna("None")
all_data["Alley"] = all_data["Alley"].fillna("None")
all_data["Fence"] = all_data["Fence"].fillna("None")
all_data["FireplaceQu"] = all_data["FireplaceQu"].fillna("None")
for col in ('GarageType', 'GarageFinish', 'GarageQual', 'GarageCond'):
all_data[col] = all_data[col].fillna('None')
for col in ('GarageYrBlt', 'GarageArea', 'GarageCars'):
all_data[col] = all_data[col].fillna(0)
for col in ('BsmtFinSF1', 'BsmtFinSF2', 'BsmtUnfSF','TotalBsmtSF', 'BsmtFullBath', 'BsmtHalfBath'):
all_data[col] = all_data[col].fillna(0)
for col in ('BsmtQual', 'BsmtCond', 'BsmtExposure', 'BsmtFinType1', 'BsmtFinType2'):
all_data[col] = all_data[col].fillna('None')
all_data["MasVnrType"] = all_data["MasVnrType"].fillna("None")
all_data["MasVnrArea"] = all_data["MasVnrArea"].fillna(0)
all_data['MSZoning'] = all_data['MSZoning'].fillna(all_data['MSZoning'].mode()[0])
all_data["LotFrontage"] = all_data.groupby("Neighborhood")["LotFrontage"].transform(
lambda x: x.fillna(x.median()))
all_data = all_data.drop(['Utilities'], axis=1)
all_data["Functional"] = all_data["Functional"].fillna("Typ")
#设置为最常见的值
all_data['Electrical'] = all_data['Electrical'].fillna(all_data['Electrical'].mode()[0])
all_data['KitchenQual'] = all_data['KitchenQual'].fillna(all_data['KitchenQual'].mode()[0])
all_data['SaleType'] = all_data['SaleType'].fillna(all_data['SaleType'].mode()[0])
all_data['Exterior1st'] = all_data['Exterior1st'].fillna(all_data['Exterior1st'].mode()[0])
all_data['Exterior2nd'] = all_data['Exterior2nd'].fillna(all_data['Exterior2nd'].mode()[0])
all_data['MSSubClass'] = all_data['MSSubClass'].fillna("None")
all_data_na = (all_data.isnull().sum() / len(all_data)) * 100
all_data_na = all_data_na.drop(all_data_na[all_data_na == 0].index).sort_values(ascending=False)
missing_data = pd.DataFrame({'Missing Ratio' :all_data_na})
print(missing_data.head())
#现在没有缺失值了4. 特征工程
字符串>数字:
#MSSubClass=The building class
all_data['MSSubClass'] = all_data['MSSubClass'].apply(str)


#Changing OverallCond into a categorical variable
all_data['OverallCond'] = all_data['OverallCond'].astype(str)


#Year and month sold are transformed into categorical features.
all_data['YrSold'] = all_data['YrSold'].astype(str)
all_data['MoSold'] = all_data['MoSold'].astype(str)

from sklearn.preprocessing import LabelEncoder
cols=('FireplaceQu', 'BsmtQual', 'BsmtCond', 'GarageQual', 'GarageCond',
        'ExterQual', 'ExterCond','HeatingQC', 'PoolQC', 'KitchenQual', 'BsmtFinType1',
        'BsmtFinType2', 'Functional', 'Fence', 'BsmtExposure', 'GarageFinish', 'LandSlope',
        'LotShape', 'PavedDrive', 'Street', 'Alley', 'CentralAir', 'MSSubClass', 'OverallCond',
        'YrSold', 'MoSold')
#字符转数字
for c in cols:
    lbl = LabelEncoder()
    lbl.fit(list(all_data[c].values))
    all_data[c] = lbl.transform(list(all_data[c].values))


print(all_data.head(5))
#增加新的列:
all_data['TotalSF'] = all_data['TotalBsmtSF'] + all_data['1stFlrSF'] + all_data['2ndFlrSF']
#提取数值型数据的索引
numeric_feats=all_data.dtypes[all_data.dtypes !='object'].index
#删除包含缺失数据的行,sort_values:按值进行排序
skewed_feats=all_data[numeric_feats].apply(lambda x:skew(x.dropna())).sort_values(ascending=False)
skewness = pd.DataFrame({'Skew' :skewed_feats})
skewness = skewness[abs(skewness) > 0.75]
from scipy.special import boxcox1p
skewed_features = skewness.index
lam = 0.15
for feat in skewed_features:
#all_data[feat] += 1
print(feat)
all_data[feat] = boxcox1p(all_data[feat], lam)
all_data = pd.get_dummies(all_data)
print(all_data.shape)
train = all_data[:ntrain]
test = all_data[ntrain:]5. 模型的建立