scikit-learn中集成学习(ensemble learn)的例子与实践
在我的上一篇博客中集成学习基本原理:Adaboost,Bagging和Stacking介绍了一些集成学习的基本原理,所以在这一篇我准备介绍一下scikit-learn中的一些例子,在官方文档中集成学习的例子很多,我当然不可能全部写在博客里面,在这里我只挑一些典型的大致讲一下。
AdaBoost
import numpy as np
import matplotlib.pyplot as plt

from sklearn.ensemble import AdaBoostClassifier
from sklearn.tree import DecisionTreeClassifier
from sklearn.datasets import make_gaussian_quantiles

# Construct dataset
X1, y1 = make_gaussian_quantiles(cov=2.,
n_samples=200, n_features=2,
n_classes=2, random_state=1)
X2, y2 = make_gaussian_quantiles(mean=(3, 3), cov=1.5,
n_samples=300, n_features=2,
n_classes=2, random_state=1)
X = np.concatenate((X1, X2))
#将产生的两个样本集合连在一起,形成总的数据集
y = np.concatenate((y1, - y2 + 1))

# Create and fit an AdaBoosted decision tree
bdt = AdaBoostClassifier(DecisionTreeClassifier(max_depth=1),algorithm="SAMME",
n_estimators=200)

bdt.fit(X, y)

plot_colors = "br"
plot_step = 0.02
class_names = "AB"

plt.figure(figsize=(10, 5))

# Plot the decision boundaries
plt.subplot(121)
x_min, x_max = X[:, 0].min() - 1, X[:, 0].max() + 1
y_min, y_max = X[:, 1].min() - 1, X[:, 1].max() + 1
xx, yy = np.meshgrid(np.arange(x_min, x_max, plot_step),
np.arange(y_min, y_max, plot_step))

Z = bdt.predict(np.c_[xx.ravel(), yy.ravel()])
Z = Z.reshape(xx.shape)
cs = plt.contourf(xx, yy, Z, cmap=plt.cm.Paired)
plt.axis("tight")
#上面依然是很常见的画图步骤,画出的是决策平面

# Plot the training points
for i, n, c in zip(range(2), class_names, plot_colors):
    idx = np.where(y == i)
    #得到第i类的点的索引
    plt.scatter(X[idx, 0], X[idx, 1],
        c=c, cmap=plt.cm.Paired,
        s=20, edgecolor='k',
        label="Class %s" % n)
plt.xlim(x_min, x_max)
plt.ylim(y_min, y_max)
plt.legend(loc='upper right')
plt.xlabel('x')
plt.ylabel('y')
plt.title('Decision Boundary')

# Plot the two-class decision scores
twoclass_output = bdt.decision_function(X)
plot_range = (twoclass_output.min(), twoclass_output.max())
plt.subplot(122)
for i, n, c in zip(range(2), class_names, plot_colors):
    plt.hist(twoclass_output[y == i],
        bins=10,
        range=plot_range,
        facecolor=c,
        label='Class %s' % n,
        alpha=.5,
        edgecolor='k')
x1, x2, y1, y2 = plt.axis()
#上面这是将两类点的决策函数值画成的直方图画在了一张图里面。
plt.axis((x1, x2, y1, y2 * 1.2))
plt.legend(loc='upper right')
plt.ylabel('Samples')
plt.xlabel('Score')
plt.title('Decision Scores')

plt.tight_layout()
plt.subplots_adjust(wspace=0.35)
plt.show()其中make_gaussian_quantiles是用来产生多维的高斯分布的函数
sklearn.datasets.make_gaussian_quantiles(mean=None, cov=1.0, n_samples=100,
n_features=2, n_classes=3, shuffe=True, random_state=None)
Generate isotropic Gaussian and label samples by quantile
This classification dataset is constructed by taking a multi-dimensional standard normal distribution and defining classes separated by nested concentric multi-dimensional spheres such that roughly equal numbers of samples are in each class .
其中主要的参数为
mean:array of shape of [n_feature]。就是正态分布的均值,是一个数组。
cov:float.代表了多维正态分布的协方差矩阵,但是这里只能输入float的值,最后的协方差矩阵为该值乘以一个单位矩阵。
n_classes:类别的个数。
其余的参数按照名字就能够看出来含义。
返回值X为产生的样本, y为对应的样本的类别。
下面是AdaBoostClassifier的API
class sklearn.ensemble.AdaBoostClassifier(base_estimator=None, n_estimators=50, learning_rate=1.0, algorithm=’SAMME.R’, random_state=None)
An AdaBoost classifer.
An AdaBoost [1] classifer is a meta-estimator that begins by fitting a classifier on the original dataset and then
fts additional copies of the classifer on the same dataset but where the weights of incorrectly classifed instances
are adjusted such that subsequent classifiers focus more on diffcult cases.
This class implements the algorithm known as AdaBoost-SAMME [2]
主要参数:
base_estimator:就是用来提升的基学习器,默认是决策树,也可以用其他的学习器,但是要支持样本权重,以及有classes_和n_classes_这些特征
learning_rate:这个到后面还会讲一下,主要就是按照原来的AdaBoost算法,在每一轮我们得到一个新的学习器以及它的权重,但是不是直接就加上原来的总的学习器,还要在乘以一个learning_rate,就是减少新的学习器的贡献,这种做法叫做shrink。较小的learning_rate确实可以减小最终的误差,但是它比较小的话,学习也比较慢,那么总的学习器个数就需要比较大,因此learning_rate和n_eatimators之间关系比较强
algorithm:只有两种算法SAMME和SAMME.R。说实话两者具体有什么差别我也不是很清楚,其中SAMME就是我在上一篇中讲的基本的AdaBoost的算法,SAMME.R中的R代表的probability,它使用概率估计来更新加性模型(就是总的那个把基本学习器加起来的模型)。总之最后SAMME.R算法能够得到更小的测试误差以及更快的收敛速度。
函数
decision_function计算输入数据的决策函数,返回的其实是一个array,大小为shape=[n_samples, k]。对于二分类问题,k==1,这时候输出的score数值分别靠近-1或者1代表样本可能是第一类或者第二类。如果不是而分类,那么k==n_classes.

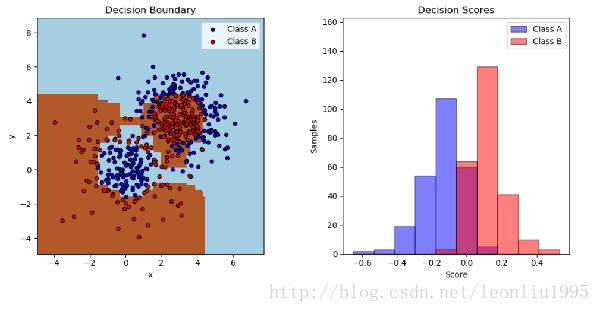
上图是最终的结果,左边是决策平面和数据点,右边是决策函数的值所画成的直方图,数值大于0的被判定成B类,小于0的被判定成A类。可以看到有一些点在0到正负0.2之间是被判定错误的。至于分数为0的我理解是在边界上的点,就像SVM里面,决策平面上的点的决策函数为0.
Gradient Boosting
梯度提升回归树(GBRT)我在上一篇博客中没有讲,后来发现他还是有些用处的,所以在这里稍微讲一下。
梯度提升跟AdaBoost还是有一定的不同,对于基础的提升树,提升树模型可以表示为决策树的加法模型:
在生成过程中,第m步的模型是
通过经验风险极小化可以确定下一棵树的参数
实际中使用决策树桩就可以有很好的效果。
当我们采用平方误差损失函数的时候,损失变成
其中 r=y−fm(x) 即为拟合之后的数据的残差,所以对于回归问题来说,实际就是不断拟合残差,使得残差尽量趋向于0。可以说这个思想是非常直观,简单的。
梯度提升方法:对于一般的损失函数,每一步的优化可能并不容易,因此梯度提升就把损失函数的负梯度在当前模型的值作为回归问题中残差的近似,也就是令
这个求导其实是有公式的,没必要一定自己去求。
然后用这个负梯度代替上面提升树里面的残差,之后求解就得到梯度提升树。
我在看《The Elements of Statical Learning》的时候发现它还有一种思路,在这里写下来供人参考。
不论是提升树还是梯度提升树,式(3)是基本的式子,在每一轮我们要求出一个能够最小化总体风险的决策树,但是这个是比较难求的。这里我们转换一下思路,在忽略约束条件的情况下,我们要求的最终的决策函数就是
类比我们印象中的一些优化问题,我们就可以用最速下降法来求解这个问题。另外值得注意的是 f={f(x1),f(x2),⋯,f(xN)} 完全可以看作是一个向量,那么使用最速下降就更容易理解了。
那么最速下降的公式为
其中 gm 为一个向量,每一个分量为
也就是在每个样本点处 L 关于 f 的梯度的分量
步长 ρm 可以通过搜索得到,也就是
上面看似解决了问题,但是梯度只定义在训练的样本点上,最后不能用于预测新的点,为了解决这个问题,我们用平方损失函数再拟合一个决策树来逼近这个梯度,也就是
上式求出来的划分区域 R~jm 可能和(3)式有所不同,但是是足够相似的。
在每一轮求出决策树和在每一个叶节点代表的区域 Rjm 上的 γjm=argminγ∑si∈RjmL(yi,fm−1(xi)+γ) 之后我们就得到 fm 的更新公式
以上就是在《The Elements of Statical Learning》中的思路。
下面是一个例子
import numpy as np
import matplotlib.pyplot as plt
from sklearn import ensemble
from sklearn import datasets

X, y = datasets.make_hastie_10_2(n_samples = 12000, random_state = 1)
#产生数据的函数,例子是hastie 的《统计学习基础》的example 10.2
X = X.astype(np.float32)
labels,y = np.unique(y, return_inverse = True)
#np.unique返回不同的数值,这里就是类别,return_inverse = True的话,还返回原来的数据对应的
#类别的编号
X_train, X_test = X[:2000], X[2000:]
y_train, y_test = y[:2000], y[2000:]
#划分训练集和测试集
original_params = {'n_estimators':1000, 'max_leaf_nodes':4, 'max_depth':None,
                  'random_state':2, 'min_samples_split':5}

#上面是原始的参数,下面可以更改 'max_leaf_nodes'即代表每个树的最大叶节点

plt.figure()
for label, color, setting in [('No shrinkage', 'orange', {'learning_rate':1.0, 'subsample':1.0}),
                             ('learning_rate = 0.1','turquoise',{'learning_rate':0.1, 'subsample':1.0}),
                             ('subsample = 0.5','blue',{'learning_rate':1.0, 'subsample':0.5}),
                             ('learning_rate = 0.1,subsample = 0.5','gray',{'learning_rate':0.1, 'subsample':0.5}),
                             ('learning_rate = 0.1, max_feature=2', 'magenta',{'learning_rate':0.1,'max_features':2})]:
    params = dict(original_params)
    params.update(setting)
    #更新参数
    clf = ensemble.GradientBoostingClassifier(**params)
    clf.fit(X_train, y_train)
    #声明分类器并训练
    test_deviance = np.zeros((params['n_estimators'],), dtype = np.float64)

    for i, y_pred in enumerate(clf.staged_decision_function(X_test)):
        test_deviance[i] =clf.loss_(y_test, y_pred)
     #在每一轮训练中计算误差   staged_decision_function计算每一轮的决策函数,返回的是一个
     #数组的生成器,大小为shape = [n_samples, n_features]

    plt.plot((np.arange(test_deviance.shape[0])+1), test_deviance,'-', color = color, label = label)
plt.legend(loc='upper left')
plt.xlabel('Boosting Iterations')
plt.ylabel('Test Set Deviance')
plt.show()
最后的结果为

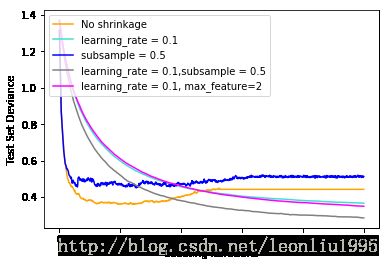
Shrinkage即为将learning_rate设为小于1.0大于0的数,从图中可以看出进行shrinkage之后误差有所减小。
所谓的shrinkage算法就是上面最后得到的更新公式中,降低每次决策树的贡献
其中 0<ν<1 , ν 越小代表每次学习的越慢,所以需要越大的总学习器个数M,或者叫循环个数,但是M太大可能影响计算速度,所以每个小的决策树需要尽量小。比较好的策略是,选择非常小的 ν ,然后通过早停决定M。
Subsample是指每次训练新的决策树的时候,只取一部分的训练数据进行训练,通常取0.5或者更少,这种方式不仅能够加快训练速度,还能够提高准确度。从上图就能看到,进行shrinkage和subsample的线是最低的。
max_features是指决策树每次分割的时候考虑的特征个数,可以是整数,就是具体考虑几个特征,也可以是其他比如”sqrt”“log2”,都是对n_features求的,比如sqrt(n_features)。max_features < n_features可以减小方差但是提高了偏差。其实它和subsample都是在一定程度上引入了多样性,使得各个基学习器之间的独立性更大。所以max_features < n_features也能减小一定的误差,但是从图中可以看出并不明显。
Random Forest
random forest 的原理我在上一篇博客里面已经介绍过了,原理很简单,就是在Bagging的基础上加入属性的随机选择,在总的属性集合的子集合中选择最佳属性。但是效果很好,一个很好的优点就是速度快,应该是由于基学习器是并行产生的原因。而这方面AdaBoost的速度就慢很多了。下面是一个比较综合性的一个例子
import numpy as np
import matplotlib.pyplot as plt
from matplotlib.colors import ListedColormap
from sklearn import clone
from sklearn.datasets import load_iris
from sklearn.ensemble import (RandomForestClassifier, ExtraTreesClassifier,
AdaBoostClassifier)
from sklearn.tree import DecisionTreeClassifier

# Parameters
n_classes = 3
n_estimators = 30
cmap = plt.cm.RdYlBu
plot_step = 0.02 # fine step width for decision surface contours
plot_step_coarser = 0.5 # step widths for coarse classifier guesses
RANDOM_SEED = 13 # fix the seed on each iteration

# Load data
iris = load_iris()

plot_idx = 1

models = [DecisionTreeClassifier(max_depth=None),
RandomForestClassifier(n_estimators=n_estimators),
ExtraTreesClassifier(n_estimators=n_estimators),
AdaBoostClassifier(DecisionTreeClassifier(max_depth=3),
n_estimators=n_estimators)]

for pair in ([0, 1], [0, 2], [2, 3]):
    for model in models:
# We only take the two corresponding features
        X = iris.data[:, pair]
        y = iris.target
#选择不同的特征
        # Shuffle
        idx = np.arange(X.shape[0])
        np.random.seed(RANDOM_SEED)
        np.random.shuffle(idx)
        X = X[idx]
        y = y[idx]
        #把数据随机打散
# Standardize
        mean = X.mean(axis=0)
        std = X.std(axis=0)
        X = (X - mean) / std
        #按照正态分布归一化
# Train
        clf = clone(model)
        #这一步好像没啥作用,删了结果也是对的
        clf = model.fit(X, y)
        #拟合模型
        scores = clf.score(X, y)
        #得出分数
# Create a title for each column and the console by using str() and
# slicing away useless parts of the string
        model_title = str(type(model)).split(
        ".")[-1][:-2][:-len("Classifier")]
        #这一步是在处理字符串,把classifier的名字提取出来
        model_details = model_title
        if hasattr(model, "estimators_"):
            model_details += " with {} estimators".format(
                len(model.estimators_))
        print(model_details + " with features", pair,
            "has a score of", scores)

        plt.subplot(3, 4, plot_idx)
        if plot_idx <= len(models):
        # Add a title at the top of each column
            plt.title(model_title)

# Now plot the decision boundary using a fine mesh as input to a
# filled contour plot
        x_min, x_max = X[:, 0].min() - 1, X[:, 0].max() + 1
        y_min, y_max = X[:, 1].min() - 1, X[:, 1].max() + 1
        xx, yy = np.meshgrid(np.arange(x_min, x_max, plot_step),
            np.arange(y_min, y_max, plot_step))
#上面这还是老套路,画网格
# Plot either a single DecisionTreeClassifier or alpha blend the
# decision surfaces of the ensemble of classifiers
        if isinstance(model, DecisionTreeClassifier):
            Z = model.predict(np.c_[xx.ravel(), yy.ravel()])
            Z = Z.reshape(xx.shape)
            cs = plt.contourf(xx, yy, Z, cmap=cmap)
        else:
# Choose alpha blend level with respect to the number
# of estimators
# that are in use (noting that AdaBoost can use fewer estimators
# than its maximum if it achieves a good enough fit early on)
            estimator_alpha = 1.0 / len(model.estimators_)
            for tree in model.estimators_:
                Z = tree.predict(np.c_[xx.ravel(), yy.ravel()])
                Z = Z.reshape(xx.shape)
                cs = plt.contourf(xx, yy, Z, alpha=estimator_alpha, cmap=cmap)

# Build a coarser grid to plot a set of ensemble classifications
# to show how these are different to what we see in the decision
# surfaces. These points are regularly space and do not have a
# black outline
        xx_coarser, yy_coarser = np.meshgrid(
            np.arange(x_min, x_max, plot_step_coarser),
            np.arange(y_min, y_max, plot_step_coarser))
        Z_points_coarser = model.predict(np.c_[xx_coarser.ravel(),
            yy_coarser.ravel()]).reshape(xx_coarser.shape)
        cs_points = plt.scatter(xx_coarser, yy_coarser, s=15,
            c=Z_points_coarser, cmap=cmap, edgecolors="none")
#画粗网格
# Plot the training points, these are clustered together and have a
# black outline
        plt.scatter(X[:, 0], X[:, 1], c=y,
            cmap=ListedColormap(['r', 'y', 'b']),
            edgecolor='k', s=20)
plot_idx += 1 # move on to the next plot in sequence

plt.suptitle("Classifiers on feature subsets of the Iris dataset")
plt.axis("tight")

plt.show()
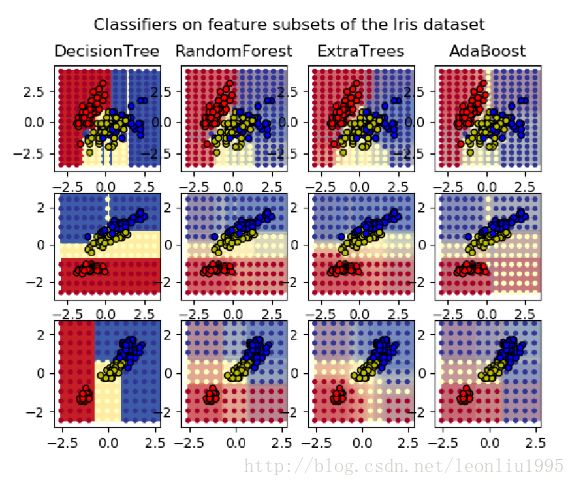
看起来代码很长,但是其实思路非常清晰,也没有什么值得说的东西。下面是最终的结果


在我将n_estimators设的比较大的时候就可以明显的感觉出来,其他几个分类器都比较慢,只有Random Forest 很快就计算完。
综上,是集成学习的几个例子,但是我还有很多没有讲到,感兴趣的可以继续深入学习。