回归模型 Boston房价预测
一、加载数据集
将取值范围差异很大的数据输入到神经网络中,这是有问题的。网络可能会自动适应这种取值范围不同的数据,但学习肯定变得更加困难。对于这种数据,普遍采用的最佳实践是对每个特征做标准化,即对于输入数据的每个特征(输入数据矩阵中的列),减去特征平均值,再除 以标准差,这样得到的特征平均值为 0,标准差为 1。用Numpy 可以很容易实现标准化。
from keras.datasets import boston_housing
(x_train, y_train), (x_test, y_test) = boston_housing.load_data()
mean = x_train.mean(axis=0)
std = x_train.std(axis=0)
x_train -= mean
x_train /= std
x_test -= mean
x_test /= std
二、构建网络
由于样本数量很少,我们将使用一个非常小的网络,其中包含两个隐藏层,每层有64 个单元。一般来说,训练数据越少,过拟合会越严重,而较小的网络可以降低过拟合。
from keras import models, layers
def build_model():
    model = models.Sequential()
    model.add(layers.Dense(64, activation='relu', input_shape=(x_train.shape[1],)))
    model.add(layers.Dense(64, activation='relu'))
    model.add(layers.Dense(1))
    model.compile(optimizer='rmsprop', loss='mse', metrics=['mae'])
    return model
三、K折验证法
import numpy as np
k = 4
num_val_samples = len(x_train) // k
num_epochs = 500
all_mae_history = []

for i in range(k):
    print('processing fold #', i)
    x_val = x_train[i*num_val_samples: (i+1)*num_val_samples]
    y_val = y_train[i*num_val_samples: (i+1)*num_val_samples]

    partial_x_train = np.concatenate(
            [x_train[: i*num_val_samples],
             x_train[(i+1)*num_val_samples :]],
             axis=0)
    partial_y_train = np.concatenate(
            [y_train[: i*num_val_samples],
             y_train[(i+1)*num_val_samples :]],
             axis=0)

    model = build_model()
    history = model.fit(partial_x_train, partial_y_train,
              validation_data=(x_val, y_val),
              epochs = num_epochs, batch_size=1,verbose=0)
    all_mae_history.append(history.history['val_mean_absolute_error'])
#可以计算每个轮次中所有折 MAE 的平均值,后面的for循环为外循环
average_mae_history = [
        np.mean([x[i] for x in all_mae_history]) for i in range(num_epochs)]
四、结果图
import matplotlib.pyplot as plt
plt.plot(range(1, len(average_mae_history)+1), average_mae_history)
plt.xlabel('Epochs')
plt.ylabel('Validation MAE')
plt.show()

#光滑
def smooth_curve(points, factor=0.9):
   smoothed_points = []
   for point in points:
        if smoothed_points:
           previous = smoothed_points[-1]
           smoothed_points.append(previous * factor + point * (1 - factor))
        else:
           smoothed_points.append(point)
    return smoothed_points

smooth_mae_history = smooth_curve(average_mae_history[10:])

plt.plot(range(1, len(smooth_mae_history) + 1), smooth_mae_history) plt.xlabel('Epochs')
plt.ylabel('Validation MAE')
plt.show()

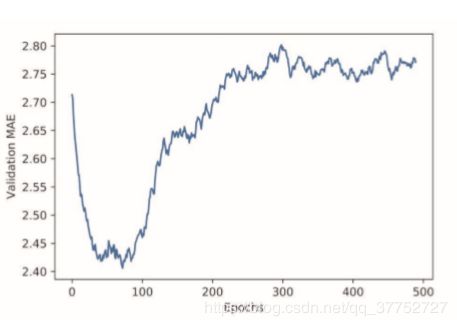
根据MAE图可知 验证 MAE 在 80 轮后不再显著降低,之后就开始过拟合。
五、各个算法效果
model = build_model()
model.fit(x_train, y_train, epochs=80, batch_size=16)
test_mse_score, test_mae_score = model.evaluate(x_test, y_test)

test_predictions = model.predict(x_test)
from sklearn.metrics import r2_score
print ('The value of R-squared of LinearRegression is', r2_score(y_test, test_predictions))
使用R-squared评价方式,可知,该神经网络模型得分为0.783
经典机器学习模型中,
GradienBoostingRegressor得分0.843,
ExtraTreesRegressor得分0.82
RandomForestRegressor得分0.80
SVM Regressor(RBF kernal)得分0.76