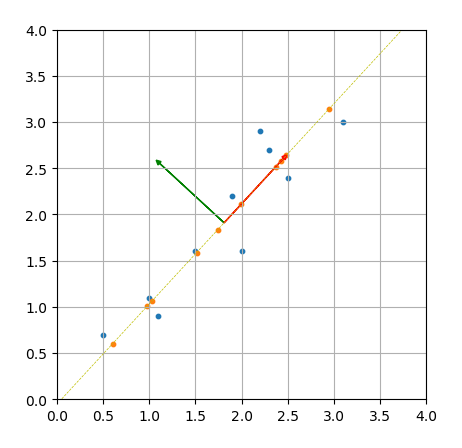
180123 PCA主成分分析的原理解释及python代码实现
主成分分析(PCA)原理详解
Matlab-PCA
Sort eigenvalues and associated eigenvectors after using numpy.linalg.eig in python
What does n[::-1] means in Python?
PCA in numpy and sklearn produces different results
How to draw a line with matplotlib?
Matplotlib.axes.Axes.plot
# -*- coding: utf-8 -*-
"""
Created on Tue Jan 23 15:56:06 2018

@author: brucelau
"""

import numpy as np
import matplotlib.pyplot as plt

fig, ax = plt.subplots()

def data_vis(d,s=0.5):
    ax.scatter(d[:,0],d[:,1],s=s)
    ax.grid()

def drawArrow1(B,m,c="pc1",):
    # fc: filling color
    # ec: edge color
    if c=='pc1':
        fc='r'
        ec='r'
        s=0.1
    else:
        fc='g'
        ec='g'
        s=0.1

    ax.arrow(m[0][0],m[1][0], B[0], B[1],
             length_includes_head=True,# 增加的长度包含箭头部分
             head_width=s, head_length=s, fc=fc, ec=ec,label='abc')
    # 注意: 默认显示范围[0,1][0,1],需要单独设置图形范围,以便显示箭头
    ax.set_xticks(np.linspace(0,4,9))
    ax.set_yticks(np.linspace(0,4,9))
    ax.set_xlim(0,4)
    ax.set_ylim(0,4)
    ax.set_aspect('equal') #x轴y轴等比例

# make data
data = np.array([[2.5,2.4],[0.5,0.7],[2.2,2.9],[1.9,2.2],[3.1,3.0],
                 [2.3,2.7],[2.0,1.6],[1.0,1.1],[1.5,1.6],[1.1,0.9]]).T
m = np.mean(data,axis=1,keepdims=1)
data_adjust = data-m
data_adjust2 = data_adjust.T
# visualize data
data_vis(data.T,s=10)

# calcalate conv
c = np.cov(data_adjust)
print('协方差矩阵:\n',c)

# calculate eigenvalues and eigenvectors
D,V = np.linalg.eig(c)
idx = D.argsort()[::-1]
D = D[idx]
V = V[:,idx]
print('特征值\n',D)
print('特征向量\n',V)

#%% get the pc1 and pc2
v1 = -V[:,0] # 确保特征向量方向和后文计算投影方向一致,故加负号
v2 = V[:,1]
print('主成分pcv-1 ',v1)
#%%
# visual eigenvector
drawArrow1(v2,m,c='pc2')
drawArrow1(v1,m,c='pc1')

#%%
# calculate the final result
final = np.dot(data_adjust.T, v1)

#%% calculate the final coordinate
theta = np.arctan(v1[1]/v1[0])
print('主成分pcv-1与x轴的夹角θ %f degree'%(theta/np.pi*180))
final_x = (final)*np.cos(theta)+m[0]
final_y = (final)*np.sin(theta)+m[1]
final_xy = np.vstack((final_x,final_y))
data_vis(final_xy.T,s=10)
ax.grid()
#%% y = k*(x-m[0])+m[1]
k = np.tan(theta)
m = m.reshape(2)
x1, y1 = [0, 4], [-k*m[0]+m[1],k*(4-m[0])+m[1]]
plt.plot(x1, y1, 'y--',linewidth=0.5)
plt.show()
plt.savefig('arrow.png', transparent = True, bbox_inches = 'tight', pad_inches = 0.25)
MatlabCode
mu = [2,3];
sigma = [1,1.5;1.5,3];
rng default  % For reproducibility
r = mvnrnd(mu,sigma,1000);
figure
plot(r(:,1),r(:,2),'+')

C = cov(r)
c = (r-mean(r))'*(r-mean(r))/999
[coeff,score,pcvar,mu,v,S] = ppca(r,2);
[coeff1,score1,latent1,tsquared1,explained1,mu1] = pca(r)

hold on;
xx = linspace(-2,6,100);
yy = 0.8809/0.4733*(xx-mu(1))+mu(2);
plot(xx,yy)