Cell:20种宏基因组学物种分类工具大比拼
文章目录
- 宏基因组学物种分类工具评测
- 日报
- 摘要
- 主要结果
- 图1. 从宏基因组样本到物种组成
- 图2. 评估分类表现的重要指标
- 表1. 分类器评估指标汇总
- 图3. 评估AUPR得分
- 图4. 评估L2距离
- 图5. 种水平分类比例
- 图6. 在ATCC均匀样本数据集中检测到的物种数量与最小丰度阈值的关系
- 图7. 计算资源消耗评测
- Reference
- 猜你喜欢
- 写在后面
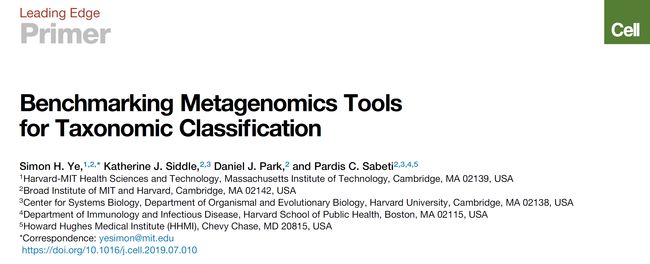
宏基因组学物种分类工具评测
Benchmarking Metagenomics Tools for Taxonomic Classification
Cell, [36.216]
2019-08-08 Review
DOI: https://doi.org/10.1016/j.cell.2019.07.010
全文可开放获取 https://www.cell.com/cell/fulltext/S0092-8674(19)30775-5
第一作者:Simon H. Ye1,2,*
通讯作者:Simon H. Ye1,2,*
其它作者:Katherine J. Siddle, Daniel J. Park, Pardis C. Sabeti
作者单位:
1 麻省理工学院,哈佛-麻省理工健康科学与技术中心(Harvard-MIT Health Sciences and Technology, Massachusetts Institute of Technology, Cambridge, MA 02139, USA)
2 麻省理工学院和哈佛大学博德研究所(Broad Institute of MIT and Harvard, Cambridge, MA 02142, USA)
日报
- 有多种软件可用于宏基因组数据的物种分类,但缺少系统的评估;
- 本文介绍了当前主流宏基因组分析方法,并对20个分类软件进行了系统评估;
- 同时介绍了评估的关键指标,为更多分类软件的评测提供了框架;
- 对数据库建索引步骤的资源消耗评估,有助于用户选择自建索引或使用同行已建索引;
- 对软件运行中内存、线程数和时间使用的评估,有利于根据自身硬件条件选择合适的软件和分析方案,预估项目所需时间。
主编评语:宏基因组测序正在彻底改变微生物物种的检测和表征,但目前软件太多,令同行选择非常困难。近日Cell杂志发文对物种分类软件系统进行了系统的评估,此文结果对同行根据自己实际情况选择最符合自身硬件条件的分析方案提供指导,以便获得较优结果。同时也为开发相关软件的同行,提供了一套系统评估软件性能的框架。
摘要
宏基因组测序正在彻底改变微生物组中物种的检测和表征,并且有多种软件工具可用于对这些数据进行分类学分类。 这些工具的快速发展和宏基因组数据的复杂性使得研究人员能够对其性能进行基准测试非常重要。 在这里,我们回顾了当前的宏基因组分析方法,并使用模拟和实验数据集评估了20个宏基因组分类器的性能。 我们描述了用于评估性能的关键指标,为其他分类器的比较提供了框架,并讨论了宏基因组数据分析的未来。
Metagenomic sequencing is revolutionizing the detection and characterization of microbial species, and a wide variety of software tools are available to perform taxonomic classification of these data. The fast pace of development of these tools and the complexity of metagenomic data make it important that researchers are able to benchmark their performance. Here, we review current approaches for metagenomic analysis and evaluate the performance of 20 metagenomic classifiers using simulated and experimental datasets. We describe the key metrics used to assess performance, offer a framework for the comparison of additional classifiers, and discuss the future of metagenomic data analysis.
主要结果
图1. 从宏基因组样本到物种组成
Figure 1 Processing Steps to Go from a Complex Metagenomic Sample to an Abundance Profile of Sample Content
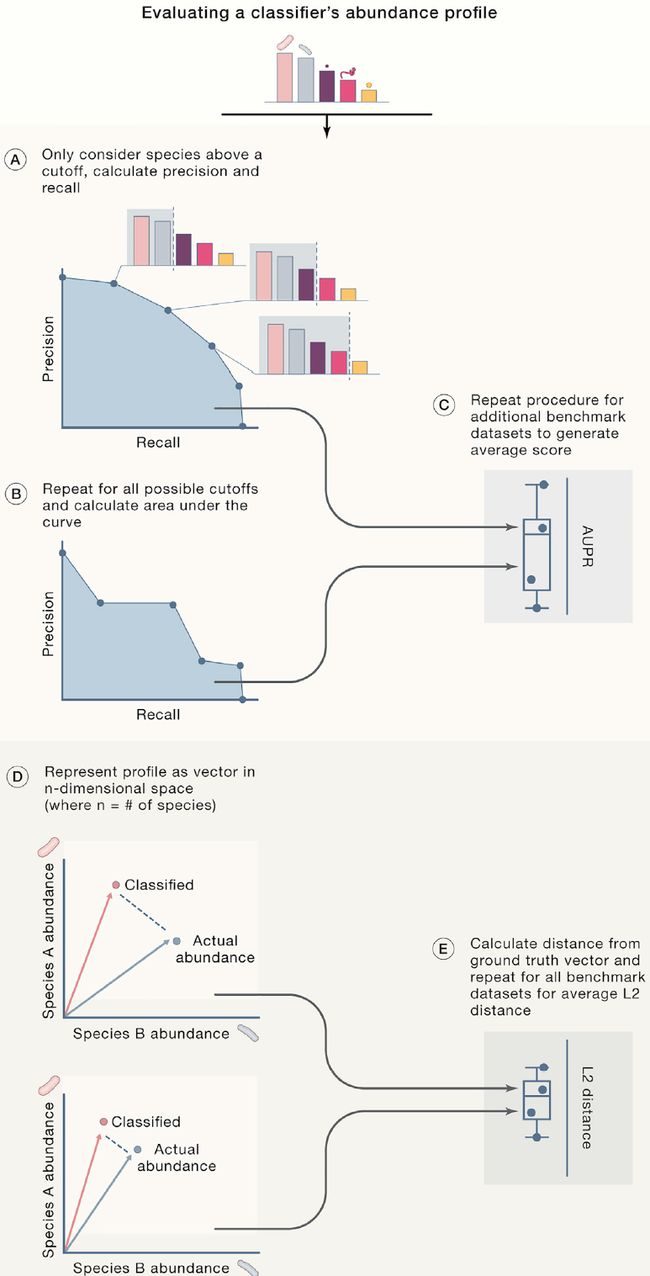
图2. 评估分类表现的重要指标
Figure 2 Metrics Used for Evaluating Classifier Performance
AUPR(area under the precision-recall
curve, 准确-召回曲线下的面积)和L2(straight-line distance between the observed and true abundance vectors,实际与预测间的直线距离)距离是两个互补的指标,分别提供对分类器准度-召回和丰度估计准确性的评估。 综合以上指标,它们提供了易于解释的分类器性能图,可用于比较分类器。
AUPR and L2 distance are two complementary metrics that provide insight into the accuracy of a classifier’s precision-recall and abundance estimates, respectively. Considered together, they provide a readily interpretable picture of classifier performance and can be used to compare classifiers.
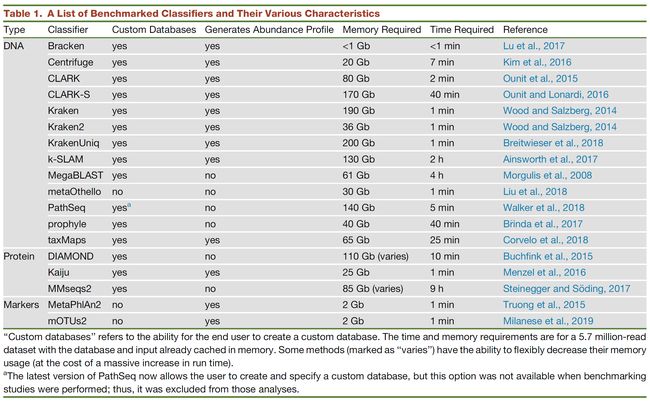
表1. 分类器评估指标汇总
Table 1 A List of Benchmarked Classifiers and Their Various Characteristics
主要包括数据库是否可定制,能否产生丰度组成长,内存消耗,时间消耗等。
“自定义数据库”是指最终用户创建自定义数据库的能力。 时间和内存要求是基于一个570万个序列的数据集,数据库和输入文件已经缓存在内存中。 某些方法(标记为“变化”)能够灵活地降低其内存使用量(以运行时间的大量增加为代价)。
a最新版本的PathSeq现在允许用户创建和指定自定义数据库,但在执行基准测试时,此选项不可用; 因此,它被排除在这些分析之外。
“Custom databases” refers to the ability for the end user to create a custom database. The time and memory requirements are for a 5.7 million-read dataset with the database and input already cached in memory. Some methods (marked as “varies”) have the ability to flexibly decrease their memory usage (at the cost of a massive increase in run time).
aThe latest version of PathSeq now allows the user to create and specify a custom database, but this option was not available when benchmarking studies were performed; thus, it was excluded from those analyses.
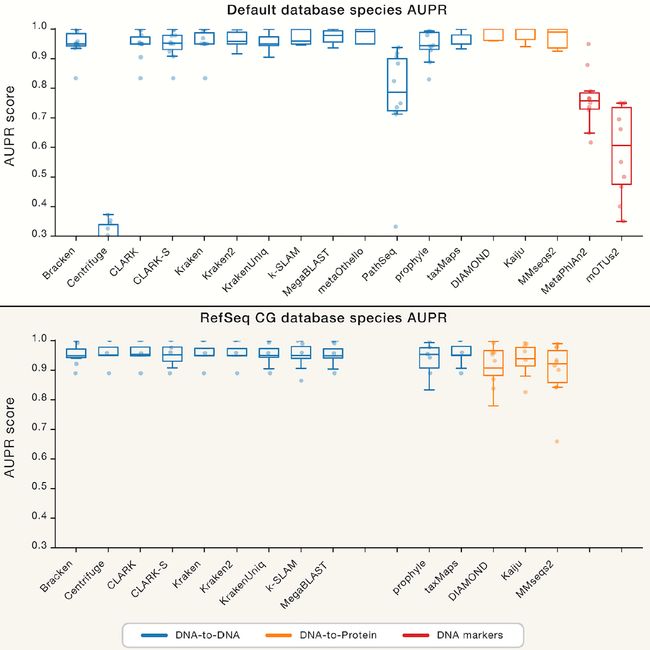
图3. 评估AUPR得分
Figure 3 Benchmark AUPR Scores
(A)物种水平上每个分类器的准确-召回率曲线(AUPR)得分下的面积(更高的值更好)。 每个绘图点代表(分类器,数据集组合)的得分。分类器按其目标类进行分组和着色(蓝色为DNA,橙色为蛋白,红色为DNA标记)。
(B)AUPR用于统一的RefSeq CG数据库而不是默认数据库。 RefSeq CG图上缺少条目是无法创建自定义数据库的分类器。可以看到,在相同数据库下,各软件表现结果差异并不大。有关其他信息,请参见图S1-S4。
(A) Area under the precision-recall curve (AUPR) scores for each classifier at the species level (a higher value is better). Each plot point represents the score for a (classifier, dataset combination). Classifiers are grouped and colored by their target class.
(B) AUPR for the uniform RefSeq CG database instead of default databases. Missing entries on the RefSeq CG plot are classifiers that cannot create custom databases.
For additional information, see Figures S1–S4.
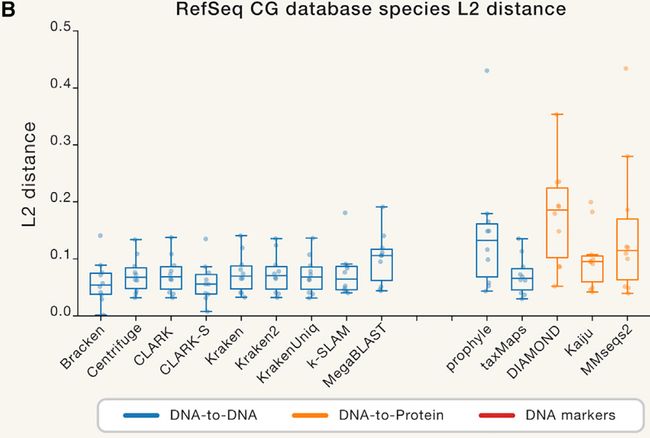
图4. 评估L2距离
Figure 4 Benchmark L2 Distances
(A)每个分类器的物种丰度分布与真实组合物之间的距离(较低的值更好)。 每个绘图点表示(分类器,数据集)组合的L2距离。 分类器按其目标类进行分组和着色。
(B)使用统一的RefSeq CG数据库的丰度距离。缺少的条目是无法创建自定义数据库的分类器。
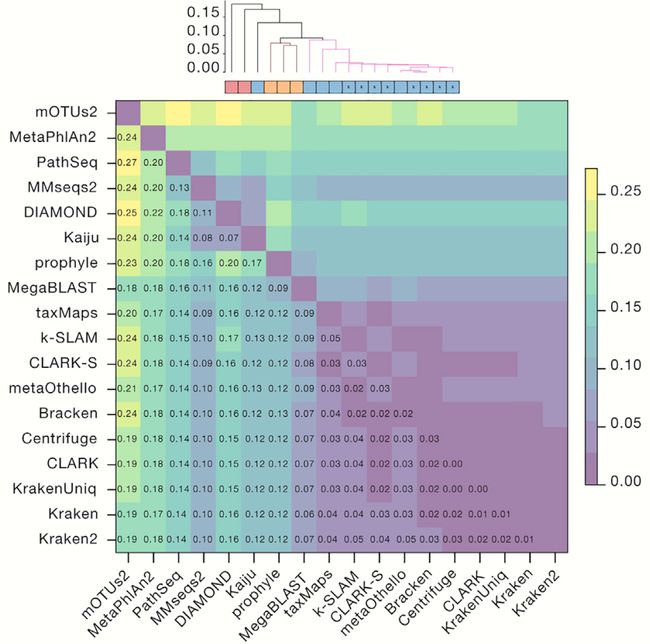
(C)跨模拟数据集的分类器之间的中位数成对L2标准丰度的层级聚类。 非黑色簇对应颜色是0.09相似度阈值的组。 彩色框对应于方法类型:DNA,蛋白质和标记分类器。 “k”注释表示基于k-mer方法。
有关其他信息,请参见图S6。
(A) Distance between the species abundance profile for each classifier compared with the true composition (a lower value is better). Each plot point represents the L2 distance for a (classifier, dataset) combination. Classifiers are grouped and colored by their target class.
(B) Abundance distance using the uniform RefSeq CG database. Missing entries are classifiers that cannot create custom databases.
© Median pairwise L2 abundance norms between classifiers across simulated datasets, hierarchically clustered. Non-black cluster link colors are groups at a 0.09 similarity threshold. Colored boxes correspond to the method type: DNA, protein, and marker classifiers. The “k” annotation indicates k-mer-based methods.
For additional information, see Figure S6.
图5. 种水平分类比例
Figure 5 Proportion of Abundance Classified at the Species Rank
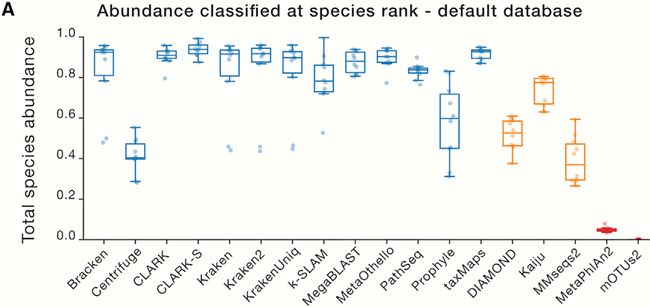
(A)用默认数据库分类物种水平的样本丰度比例。
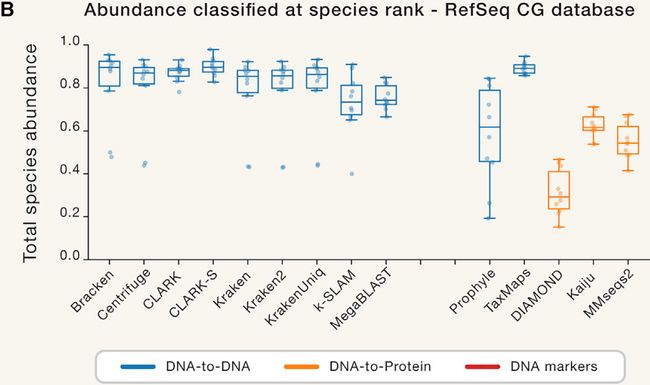
(B)使用统一的RefSeq CG数据库。仅显示允许自定义数据库的程序。有关其他信息,请参见图S5。
(A) Proportion of sample abundance classified at the species rank with default databases.
(B) Using uniform RefSeq CG databases. Only programs allowing custom databases are shown.
For additional information, see Figure S5.
图6. 在ATCC均匀样本数据集中检测到的物种数量与最小丰度阈值的关系
Figure 6 Number of Species Classified versus Minimum Abundance Threshold Detected in ATCC Even Sample Datasets
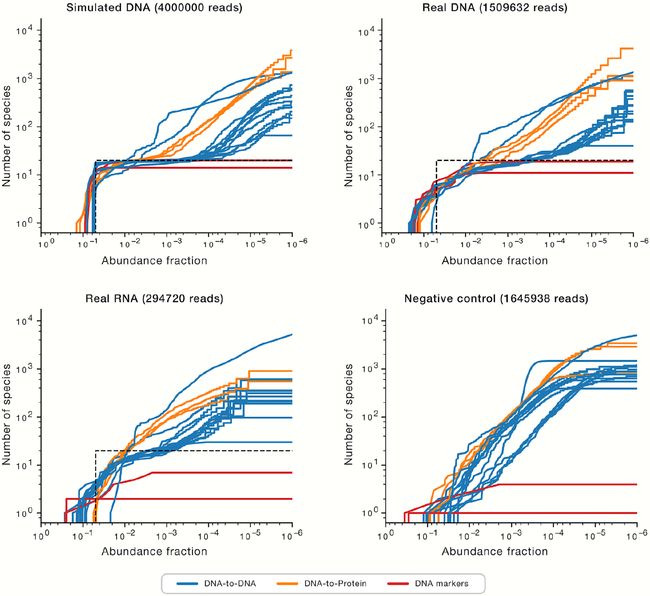
每种0.05丰度的20种物种的真实丰度被描绘为黑色虚线。
有关其他信息,请参见图S7-S9。
The truth abundance of 20 species at 0.05 abundance each is depicted as a black dotted line.
图7. 计算资源消耗评测
Figure 7 Benchmark of Computational Resources

[外链图片转存失败(img-ezxoPfX2-1565528683972)(http://210.75.224.110/Note/LiuYongXin/190810Cell/7b.png)]
[外链图片转存失败(img-bh9HwPFp-1565528683973)(http://210.75.224.110/Note/LiuYongXin/190810Cell/7c.png)]
(A)处理含有570万条序列样本所需的时间,而不是第一次运行后的第二次运行所需的时间。 对于许多分类器,第二次运行更快,因为样本序列和数据库文件缓存在内存中。 Bracken没有绘制,因为它需要的时间和内存可以忽略不计。
(B)每个分类器在执行期间使用的最大内存,磁盘上数据库大小以及32个可用CPU的平均使用数。
(C)使用各种方法创建RefSeq CG数据库所花费的时间和内存。 分类器按照增加的时间排序。 MMseqs2和DIAMOND在数据库构建期间不对基因组进行索引,而是在样本分类期间即时索引。
(A) Time required to process a sample containing 5.7 million reads versus a second run immediately after the first. This second run is faster for many classifiers because sample reads and database files are cached in memory. Bracken is not plotted because it requires negligible time and memory.
(B) The maximum memory utilized by each classifier during execution, the on-disk database size, and average number of CPUs utilized of 32 available.
© Time taken and memory used to create the RefSeq CG database using various methods. Classifiers are sorted by increasing time taken. MMseqs2 and DIAMOND do not index the genomes during database construction but, rather, index on the fly during sample classification.
Reference
https://www.cell.com/cell/fulltext/S0092-8674(19)30775-5
Ye, S.H., Siddle, K.J., Park, D.J., and Sabeti, P.C. (2019). Benchmarking Metagenomics Tools for Taxonomic Classification. Cell 178, 779-794.
猜你喜欢
- 10000+: 菌群分析
宝宝与猫狗 提DNA发Nature 实验分析谁对结果影响大 Cell微生物专刊 肠道指挥大脑 - 系列教程:微生物组入门 Biostar 微生物组 宏基因组
- 专业技能:生信宝典 学术图表 高分文章 不可或缺的人
- 一文读懂:宏基因组 寄生虫益处 进化树
- 必备技能:提问 搜索 Endnote
- 文献阅读 热心肠 SemanticScholar Geenmedical
- 扩增子分析:图表解读 分析流程 统计绘图
- 16S功能预测 PICRUSt FAPROTAX Bugbase Tax4Fun
- 在线工具:16S预测培养基 生信绘图
- 科研经验:云笔记 云协作 公众号
- 编程模板: Shell R Perl
- 生物科普: 肠道细菌 人体上的生命 生命大跃进 细胞暗战 人体奥秘
写在后面
为鼓励读者交流、快速解决科研困难,我们建立了“宏基因组”专业讨论群,目前己有国内外5000+ 一线科研人员加入。参与讨论,获得专业解答,欢迎分享此文至朋友圈,并扫码加主编好友带你入群,务必备注“姓名-单位-研究方向-职称/年级”。技术问题寻求帮助,首先阅读《如何优雅的提问》学习解决问题思路,仍末解决群内讨论,问题不私聊,帮助同行。
点击阅读原文,跳转最新文章目录阅读
https://mp.weixin.qq.com/s/5jQspEvH5_4Xmart22gjMA

