数据可视化之matlibplot(03)--饼图&圆环图&箱线图&棉棒图&误差棒图&带误差棒的柱状图&子图
饼图&圆环图&箱线图&棉棒图&误差棒图&带误差棒的柱状图&子图
- 函数及参数
- 简单饼图绘图
- 列表里的数据是小数时,按照小数所对应分数计算
- 列表里的数据是整数时,按照百分比计算
- label(s)--标签(饼图外侧显示的说明文字)
- explode--与圆心的距离
- startangle--起始绘制角度(默认从x轴正方向逆时针画起)
- shadow--在饼图下面画一个阴影。默认值为False
- labeldistance--label标签的位置(与半径成比例,默认值为1.1)
- autopct--控制饼图内百分比设置
- pctdistance--指定autopct的位置刻度(饼图百分比与圆心的距离,默认值为0.6)
- radius--饼图半径,默认值为1
- counterclock--指定指针方向(默认为True,逆时针)
- frame--绘制带有表的轴框架
- textprops--设置标签和比例文字的格式
- legend--图例
- 默认设置
- bbox_to_anchor
- ncol
- borderaxespad--图例的内边距
- 圆环图
- 箱线图
- notch--是否是凹口的形式展现箱线图,默认非凹口
- sym--指定异常点的形状,默认为+号显示
- 棉棒图
- 棉棒的样式--linefmt
- 棉棒末端的样式--markerfmt
- markerfmt = 's'
- markerfmt = '*'
- 指定基线的样式--basefmt
- bottom--设置基线位置
- 误差棒图
- fmt--数据点的标记样式和数据点标记的连接样式
- ecolor--误差棒的线条颜色
- 误差棒的线条粗细
- ms--数据点的大小
- mfc--数据点的颜色
- mec--数据点的边缘颜色
- capsize--误差棒边界横杠的大小
- capthick--误差棒边界横杠的厚度
- 带误差棒的柱状图
- 子图
函数及参数
plt.pie()
| 属性 | 说明 | 类型 |
|---|---|---|
| x | 数据 | list |
| labels | 标签 | list |
| autopct | 数据标签 | %0.1%% 保留一位小数 |
| explode | 突出的部分 | list |
| shadow | 是否显示阴影 | bool |
| pctdistance | 数据标签的距离圆心位置 | 0~1 |
| labeldistance | 标签的比例 | float |
| startangle | 开始绘图的角度 | float |
| radius | 半径长 | 默认是1 |
简单饼图绘图
列表里的数据是小数时,按照小数所对应分数计算
x = [0.1,0.5,0.2]
plt.pie(x)
列表里的数据是整数时,按照百分比计算
x = [1,5,2]
plt.pie(x)
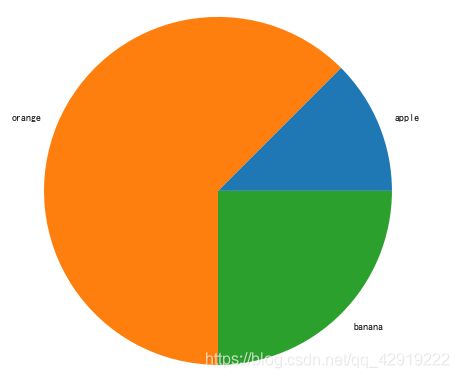
label(s)–标签(饼图外侧显示的说明文字)
x = [1,5,2]
plt.pie(x,labels=["apple","orange","banana"])
explode–与圆心的距离
x = [1,5,2]
plt.pie(x,labels=["apple","orange","banana"],
		explode=[0.1,0,0])
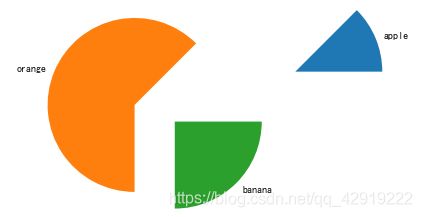
x = [1,5,2]
plt.pie(x,labels=["apple","orange","banana"],
		explode=[1.5,0.5,0])
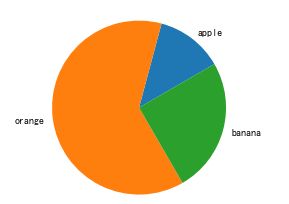
startangle–起始绘制角度(默认从x轴正方向逆时针画起)
x = [1,5,2]
plt.pie(x,labels=["apple","orange","banana"],
        startangle=30)
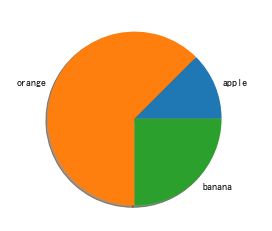
shadow–在饼图下面画一个阴影。默认值为False
x = [1,5,2]
plt.pie(x,labels=["apple","orange","banana"],
        shadow=True)
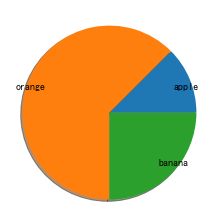
labeldistance–label标签的位置(与半径成比例,默认值为1.1)
x = [1,5,2]
plt.pie(x,labels=["apple","orange","banana"],
        shadow=True,
        labeldistance=0.8)
x = [1,5,2]
plt.pie(x,labels=["apple","orange","banana"],
        shadow=True,
        labeldistance=0.5)
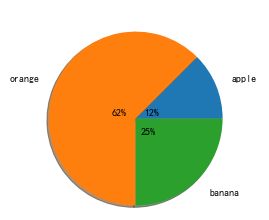
autopct–控制饼图内百分比设置
’%1.1f’指小数点前后位数(没有用空格补齐)
x = [1,5,2]
plt.pie(x,labels=["apple","orange","banana"],
        shadow=True,
        labeldistance=1.2,
        autopct='%1.1f')
x = [1,5,2]
plt.pie(x,labels=["apple","orange","banana"],
        shadow=True,
        labeldistance=1.2,
        autopct='%1.1f%%')
x = [1,5,2]
plt.pie(x,labels=["apple","orange","banana"],
        shadow=True,
        labeldistance=1.2,
        autopct='%.0f%%')
pctdistance–指定autopct的位置刻度(饼图百分比与圆心的距离,默认值为0.6)
x = [1,5,2]
plt.pie(x,labels=["apple","orange","banana"],
        shadow=True,
        labeldistance=1.2,
        autopct='%.0f%%',
        pctdistance=0.2)
x = [1,5,2]
plt.pie(x,labels=["apple","orange","banana"],
        shadow=True,
        labeldistance=1.2,
        autopct='%0.f%%',
        pctdistance=1.6)
radius–饼图半径,默认值为1
x = [1,5,2]
plt.pie(x,labels=["apple","orange","banana"],
        radius=2)
counterclock–指定指针方向(默认为True,逆时针)
x = [1,5,2]
plt.pie(x,labels=["apple","orange","banana"],
        counterclock=False)
frame–绘制带有表的轴框架
x = [1,5,2]
plt.pie(x,labels=["apple","orange","banana"],
        frame=True)
x = [1,5,2]
plt.pie(x,labels=["apple","orange","banana"],
        frame=True)
plt.xlim(-1,1)
plt.ylim(-1,1)
plt.grid()
textprops–设置标签和比例文字的格式
x = [1,5,2]
plt.pie(x,labels=["apple","orange","banana"],
        textprops={'fontsize':20,'color':'blue'})
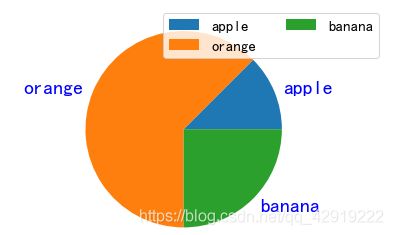
legend–图例
默认设置
x = [1,5,2]
plt.pie(x,labels=["apple","orange","banana"],
        textprops={'fontsize':20,'color':'blue'})
plt.axis("equal")#将饼图显示为正圆
plt.legend()
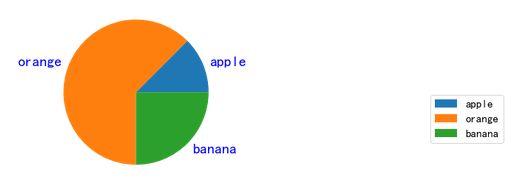
bbox_to_anchor
x = [1,5,2]
plt.pie(x,labels=["apple","orange","banana"],
        textprops={'fontsize':20,'color':'blue'})
plt.axis("equal")#将饼图显示为正圆
plt.legend(loc="upper right",#位于右上角
           fontsize=15,   #图例字体大小
           bbox_to_anchor=(2,0.5),#外边距:上边&右边,默认值[0.5,0.5]
           borderaxespad=0.3,#图例的内边距
           #ncol=2
          )#ncol=2分两列
当bbox_to_anchor=(1,1.05):

当bbox_to_anchor=(2,0.5):
ncol
x = [1,5,2]
plt.pie(x,labels=["apple","orange","banana"],
        textprops={'fontsize':20,'color':'blue'})
plt.axis("equal")#将饼图显示为正圆
plt.legend(loc="upper right",#位于右上角
           fontsize=15,
           bbox_to_anchor=(1.1,1.05),#外边距:上边&右边,默认值[0.5,0.5]
           borderaxespad=0.3,#图例的内边距
           ncol=2)#ncol=2分两列
borderaxespad–图例的内边距
当borderaxespad=0.1:

当borderaxespad=4: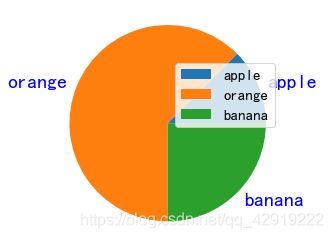
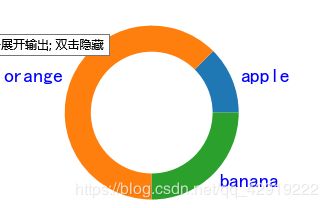
圆环图
x = [1,5,2]
plt.pie(x,labels=["apple","orange","banana"],
        textprops={'fontsize':20,'color':'blue'})
plt.pie([1],colors='w',radius=0.7)
箱线图
由五个数值点组成:最小值、下四分位数、中位数、上四分位数、最大值。
下四分位数、中位数、上四分位数组成一个“带有间隔的盒子”。
上四分位数到最大值之间建立一条延伸线,这个延伸线成为“胡须”。
plt.boxplot()
| 参数 | 说明 |
|---|---|
| x | 指定要绘制箱线图的数据 |
| notch | 是否是凹口的形式展现箱线图,默认非凹口 |
| sym | 指定异常点的形状,默认为+号显示 |
| vert | 是否需要将箱线图垂直摆放,默认垂直摆放 |
| whis | 指定上下须与上下四分位的距离,默认为1.5倍的四 分位差 |
| positions | 指定箱线图的位置,默认为[0,1,2…] |
| widths | 指定箱线图的宽度,默认为0.5 |
| patch_ artist: | 是否填充箱体的颜色 |
| meanline | 是否用线的形式表示均值,默认用点来表示 |
| showmeans | 是否显示均值,默认不显示 |
| showcaps | 是否显示箱线图顶端和末端的两条线,默认显示 |
| showbox | 是否显示箱线图的箱体,默认显示 |
| showfliers | 是否显示异常值,默认显示 |
| boxprops | 设置箱体的属性,如边框色,填充色等 |
| labels | 为箱线图添加标签,类似于图例的作用 |
| filerprops | 设置异常值的属性,如异常点的形状、大小、填充色等 |
| medianprops | 设置中位数的属性,如线的类型、粗细等 |
| meanprops | 设置均值的属性,如点的大小、颜色等 |
| capprops | 设置箱线图顶端和末端线条的属性,如颜色、粗细等 |
| whiskerprops | 设置须的属性,如颜色、粗细、线的类型等 |
data = [np.random.normal(0,std,100) for std in range(1,4)]
plt.boxplot(data)
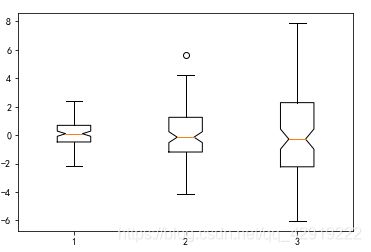
notch–是否是凹口的形式展现箱线图,默认非凹口
data = [np.random.normal(0,std,100) for std in range(1,4)]
plt.boxplot(data,notch=True)
sym–指定异常点的形状,默认为+号显示
data = [np.random.normal(0,std,100) for std in range(1,4)]
plt.boxplot(data,notch=True,
           sym = '*',#异常点的形状
           )
plt.boxplot(data)
棉棒图
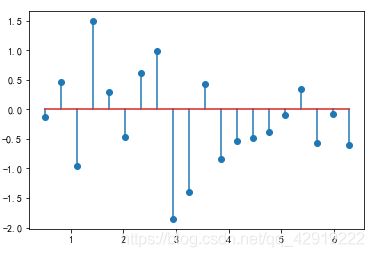
plt.stem()
x = np.linspace(0.5,2*np.pi,20)
y = np.random.randn(20)
plt.stem(x,y)
棉棒的样式–linefmt
#棉棒图
x = np.linspace(0.5,2*np.pi,20)
y = np.random.randn(20)
plt.stem(x,y,
        linefmt = '-.'#棉棒的样式
        )
棉棒末端的样式–markerfmt
#棉棒图
x = np.linspace(0.5,2*np.pi,20)
y = np.random.randn(20)
plt.stem(x,y,
        linefmt = '-.',#棉棒的样式
        markerfmt = 's',#棉棒末端的样式
        )
markerfmt = ‘s’
markerfmt = ‘*’
指定基线的样式–basefmt
#棉棒图
x = np.linspace(0.5,2*np.pi,20)
y = np.random.randn(20)
plt.stem(x,y,
        linefmt = '-.',#棉棒的样式
        markerfmt = '*',#棉棒末端的样式
        basefmt = '--',#指定基线的样式
        )
bottom–设置基线位置
x = np.linspace(0.5,2*np.pi,20)
y = np.random.randn(20)
plt.stem(x,y,
        linefmt = '-.',#棉棒的样式
        markerfmt = '*',#棉棒末端的样式
        basefmt = '--',#指定基线的样式
        bottom=1
        )
误差棒图
plt.errorbar()
x = np.linspace(-4,4,10)
y = np.sin(x)
plt.errorbar(x,y,yerr = 0.2,xerr = 0.2)
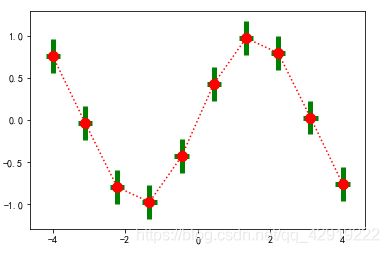
fmt–数据点的标记样式和数据点标记的连接样式
x = np.linspace(-4,4,10)
y = np.sin(x)
plt.errorbar(x,y,yerr = 0.2,xerr = 0.2,fmt='ro:')
ecolor–误差棒的线条颜色
x = np.linspace(-4,4,10)
y = np.sin(x)
plt.errorbar(x,y,yerr = 0.2,xerr = 0.2,fmt='ro:',
            ecolor='g')
误差棒的线条粗细
x = np.linspace(-4,4,10)
y = np.sin(x)
plt.errorbar(x,y,yerr = 0.2,xerr = 0.2,fmt='ro:',
            ecolor='g',
            elinewidth = 5)
ms–数据点的大小
x = np.linspace(-4,4,10)
y = np.sin(x)
plt.errorbar(x,y,yerr = 0.2,xerr = 0.2,fmt='ro:',
            ecolor='g',
            elinewidth = 5,
            ms = 10)
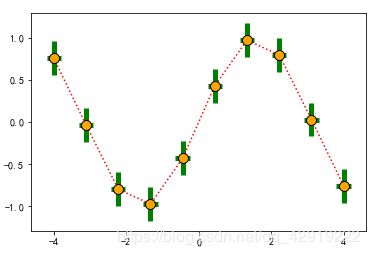
mfc–数据点的颜色
x = np.linspace(-4,4,10)
y = np.sin(x)
plt.errorbar(x,y,yerr = 0.2,xerr = 0.2,fmt='ro:',
            ecolor='g',
            elinewidth = 5,
            ms=10,
            mfc='orange')
mec–数据点的边缘颜色
x = np.linspace(-4,4,10)
y = np.sin(x)
plt.errorbar(x,y,yerr = 0.2,xerr = 0.2,fmt='ro:',
            ecolor='g',
            elinewidth = 5,
            ms=10,
            mfc='orange',
            mec='black')
capsize–误差棒边界横杠的大小
x = np.linspace(-4,4,10)
y = np.sin(x)
plt.errorbar(x,y,yerr = 0.2,xerr = 0.2,fmt='ro:',
            ecolor='g',
            elinewidth = 5,
            ms=10,
            mfc='orange',
            mec='black',
            capsize=10)
capthick–误差棒边界横杠的厚度
x = np.linspace(-4,4,10)
y = np.sin(x)
plt.errorbar(x,y,yerr = 0.2,xerr = 0.2,fmt='ro:',
            ecolor='g',
            elinewidth = 5,
            ms=10,
            mfc='orange',
            mec='black',
            capsize=10,
            capthick=5)
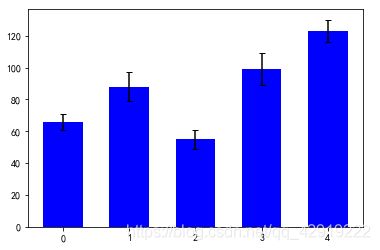
带误差棒的柱状图
x = np.arange(5)
y = [66,88,55,99,123]
err = [5,9,6,10,7]
err_attri = dict(elinewidt=2,ecolor="black",capsize=3)

plt.bar(x,y,
       color = 'b',
       width = 0.6,
       align = 'center',
       yerr = err,
       error_kw = err_attri)
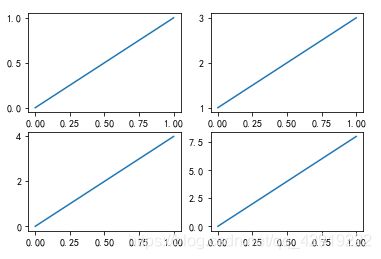
子图
plt.figure()
plt.subplot(2,2,1)
plt.plot([0,1],[0,1])

plt.subplot(2,2,2)
plt.plot([0,1],[1,3])

plt.subplot(223)
plt.plot([0,1],[0,4])

plt.subplot(224)
plt.plot([0,1],[0,8])
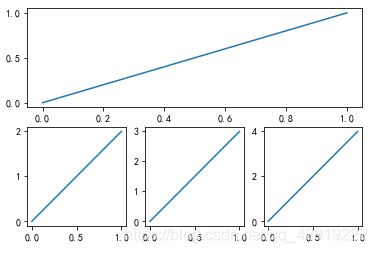
plt.figure()
plt.subplot(2,1,1)
plt.plot([0,1],[0,1])

plt.subplot(2,3,4)
plt.plot([0,1],[0,2])

plt.subplot(235)
plt.plot([0,1],[0,3])

plt.subplot(236)
plt.plot([0,1],[0,4])
ax1 = plt.subplot2grid((3,3),(0,0))
ax2 = plt.subplot2grid((3,3),(1,0))
ax3 = plt.subplot2grid((3,3),(0,2),rowspan=3)
ax4 = plt.subplot2grid((3,3),(2,0),colspan=2)
ax5 = plt.subplot2grid((3,3),(0,1),rowspan=2)
import numpy as np
ax1 = plt.subplot2grid((3,3),(0,0))
ax2 = plt.subplot2grid((3,3),(1,0))
ax3 = plt.subplot2grid((3,3),(0,2),rowspan=3)
ax4 = plt.subplot2grid((3,3),(2,0),colspan=2)
ax5 = plt.subplot2grid((3,3),(0,1),rowspan=2)

x = np.linspace(0,10,100)
y = np.exp(x)
ax1.plot(x,y)


