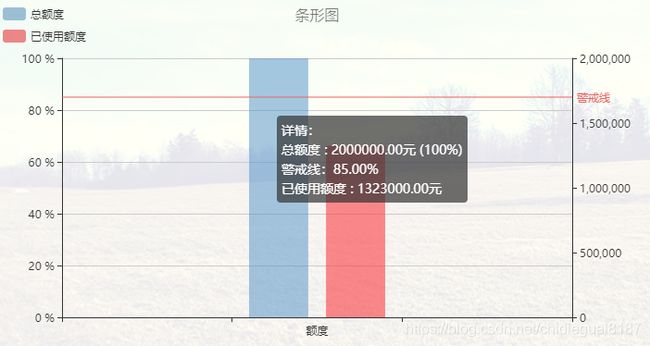
Echarts 在条形图中,如何加一条警戒线(markline),y轴双轴,警戒线单位为百分比
Echarts条形图
警戒线主要用markline属性来实现,参考的官网API地址:http://echarts.baidu.com/api.html#echarts
话不多说直接上图

这里主要实现的是添加警戒线,y轴为双轴,左侧是警戒线的单位,右侧是额度的单位
源码:
	var dom1 = " " ;
        $('.content').append(dom1);
        var myChart = echarts.init(document.getElementById('myChart1'));


        option = {
            title : {
                text: '条形图',
                x:'center',
                textStyle:{//标题内容的样式
                    color:'#696969',//
                    fontStyle:'normal',//主标题文字字体风格,默认normal,有italic(斜体),oblique(斜体)
                    fontWeight:"lighter",//可选normal(正常),bold(加粗),bolder(加粗),lighter(变细),100|200|300|400|500...
                    fontFamily:"san-serif",//主题文字字体,默认微软雅黑
                    fontSize:16//主题文字字体大小
                }
            },
            tooltip: {
                trigger: 'axis',
                axisPointer : {            // 坐标轴指示器,坐标轴触发有效
                    type : 'none'        // 默认为直线,可选为:'line' | 'shadow'
                },
                formatter: function(datas)
                {
                    var res = "详情:" + '
';
                    res += datas[0].seriesName + ' : ' +initdata+'元   ('+ datas[0].value + '%)'+ '
';
                    res += '警戒线:'+maxvalue+'%' + '
';
                    res += datas[1].seriesName + ' : ' + datas[1].value + '元'+ '
';
                    return res;
                }


            },
            toolbox: {
                show : false
            },
            legend: {
                selectedMode:false, //关闭点击事件
                data:['总额度','已使用额度'],
                orient: 'vertical',
                left: 'left', //图标放在左边
            },
            xAxis: [//设置x轴
                {
                    type: 'category',
                    data: ['','额度',''],
                }
            ],
            yAxis: [//设置y轴
                {
                    type: 'value',
                    min: 0,
                    max: 100,
                    interval: 20,
                    axisLabel: {
                        show: true,
                        interval: 'auto',
                        formatter: '{value} %'
                    },
                },
                {
                    type: 'value',
                    splitLine: { show: false },
                    min: 0,
                    max: initdata,
                    formatter: '{value}元'
                }
            ],
            series: [
                {
                    name:'总额度',
                    type:'bar',
                    data:bardata,//数据
                    itemStyle: {
                        normal:{
                            color: function (params){
                                var colorList = [
                                    'rgba(70, 130, 180, 0.5)',
                                    'rgba(70, 130, 180, 0.5)',
                                    'rgba(70, 130, 180, 0.5)',
                                   ];
                                return colorList[params.dataIndex];
                            }
                        }
                    },
                    markLine : {
                        symbol:"none",               //去掉警戒线最后面的箭头
                        label:{
                            position:"end",         //将警示值放在哪个位置,三个值“start”,"middle","end"  开始  中点 结束
                            formatter: "警戒线"
                        },
                        data : [{
                            silent:false,             //鼠标悬停事件  true没有,false有
                            lineStyle:{               //警戒线的样式  ,虚实  颜色
                                type:"solid",
                                color:"rgba(238, 99, 99)"
                            },
                            name: '警戒线',
                            yAxis: MAXVALUE
                        }]
                    }
                },
                {
                    name:'已使用额度',
                    type:'bar',
                    data:bardata2,//数据
                    yAxisIndex:1,
                    itemStyle: {
                        normal:{
                            color: function (params){
                                var colorList = [
                                    'rgba(228, 57, 60, 0.6)',
                                    'rgba(228, 57, 60, 0.6)',
                                    'rgba(228, 57, 60, 0.6)',
                                    ];
                                return colorList[params.dataIndex];
                            }
                        }
                    }
                }
            ]
        };
        // 使用刚指定的配置项和数据显示图表。
        myChart.setOption(option);
Echarts中,实现双轴,主要是两个地方配置,第一个在yAxis中配置,第二个在series中配置,
实现markline,在相对应的series中,配置markline属性,Label来调控标签显示的位置以及样式