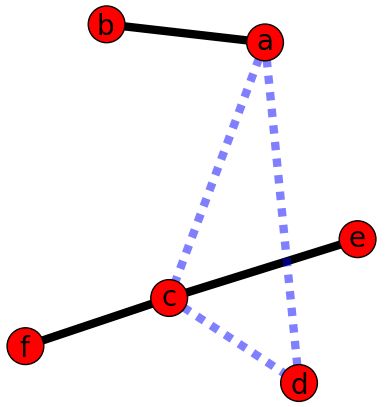
首先输入边和边的权重,随后画出节点位置。依据权重大小划分实边和虚边
#coding:utf-8
#!/usr/bin/env python
"""
An example using Graph as a weighted network.
"""
__author__ = """Aric Hagberg ([email protected])"""
try:
    import matplotlib.pyplot as plt
except:
    raise

import networkx as nx

G=nx.Graph()
#加入带权边
G.add_edge('a','b',weight=0.6)
G.add_edge('a','c',weight=0.2)
G.add_edge('c','d',weight=0.1)
G.add_edge('c','e',weight=0.7)
G.add_edge('c','f',weight=0.9)
G.add_edge('a','d',weight=0.3)
#按权重划分为重权值得边和轻权值的边
elarge=[(u,v) for (u,v,d) in G.edges(data=True) if d['weight'] >0.5]
esmall=[(u,v) for (u,v,d) in G.edges(data=True) if d['weight'] <=0.5]
#节点位置
pos=nx.spring_layout(G) # positions for all nodes
#首先画出节点位置
# nodes
nx.draw_networkx_nodes(G,pos,node_size=700)
#依据权重,实线为权值大的边,虚线为权值小的边
# edges
nx.draw_networkx_edges(G,pos,edgelist=elarge,
                    width=6)
nx.draw_networkx_edges(G,pos,edgelist=esmall,
                    width=6,alpha=0.5,edge_color='b',style='dashed')

# labels标签定义
nx.draw_networkx_labels(G,pos,font_size=20,font_family='sans-serif')

plt.axis('off')
plt.savefig("weighted_graph.png") # save as png
plt.show() # display