数据分析(三)实战——分类模型(随机森林与 AdaBoost )
数据分析(三)实战——分类模型(随机森林与 AdaBoost )
- 基本信息
- 数据预处理
- 观察数据集特点
- 数据集划分
- 特征选择
- 异常值检测
- 离散化
- 标准化
- 模型训练
- 分类器选择
- 评估指标选择
- 训练过程
- 默认参数训练结果
- 参数调整
- 最优训练结果
- 结语
前言:根据个人的学习经历,最无奈的就是前面学习了一大堆的零碎知识点,却压根不知道怎么去使用,更不清楚前面所学的哪个知识点可以在哪里派上用场。所以这第三篇文章笔者打算先拿一个简单的案例作为实战演练(之前专业课程的大作业之一),争取在实战中,每个处理环节如何与学习过程挂钩。不过事实声明:由于只是个小数据集,而且是介绍性质,许多处理过程不会与商业上的处理过程一样(比如会省去大量的前期清洗操作),也不会与比赛有可比性(Kaggle上的大神都是套用了一个一个又一个的复杂模型的,膜)。但这不会影响你从上帝视角去做到学以致用。
基本信息
- 数据集:Wine Quality (同时建议你看下构建这个数据集的作者的 论文 )
– 其中包含了红酒和白酒两个文件,本文只使用白酒数据集,即 winequality-white.csv;
– 白酒数据集包含了 4898 个样本,每个样本包含了【 11 个特征值】+【 1 个类别标签】(即 quality,白酒品质),如下图:
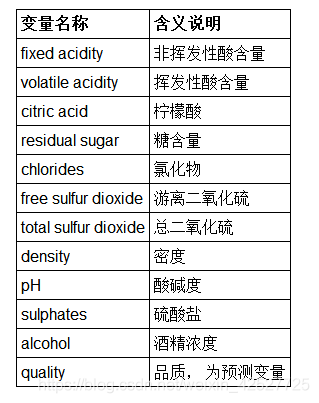
- 基本任务:对白酒品质做分类,即构建分类模型,使其能够以 11 个特征为输入、尽可能准确地预测出白酒的品质。
数据预处理
观察数据集特点
- 首先从数据集的介绍文档中看到,该数据集无缺失值,因此基本上无需使用缺失值处理(为何说“基本上”?回顾 数据分析(二) 中异常值的处理方式);
- 只有不到 5000 个数据样本,不算多,在训练过程中要注意观察是否会过拟合或欠拟合;
- 从 csv 文件中看出,作者没有使用逗号作为分隔符,导致数据以字符串的形式“挤”在一个格子中,需要将其分割开;尤其是表头中,除了第一个属性名称外都因此带上了双引号,强迫症患者要注意啦;另外是各个特征之间的量级差别较大,标准化的需求比较明显;
- 借用 DataFrame.describe() 不难发现样本的重复率有 20% 左右,最高的一条样本重复了 8 次,为了放大单条样本的作用(也是减少重复收集相同数据的概率),建议去重(可用 DataFrame.drop_duplicates() 函数,下面的数据和实验都是去重后的统计结果);

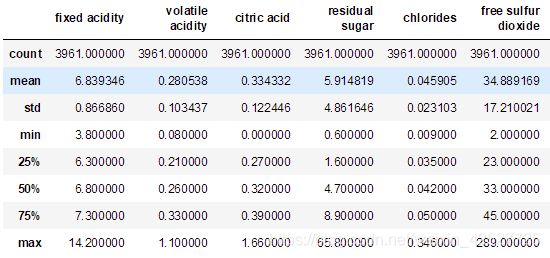
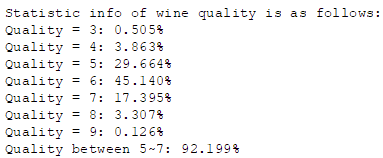
- 数据分布极不均匀,多集中在均值附近,如下图为简单过后的数据中部分统计结果。一方面看出比较适合使用 Z-Score 和 Logistic 的标准化方法,另一方面两端数据较稀疏,可以考虑将其作为异常值去掉(或者使用 LOF);注意,在样本中,白酒品质最低为 3 ,最高为 9 ;
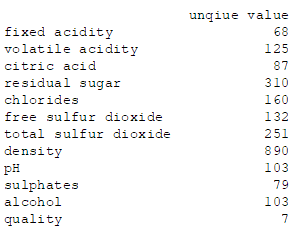
- 特征应该多为连续值,个别特征的取值个数比较多,需要进行离散化处理;
''' 分割数据的代码可参考这个 '''
import codecs

'''
columns = ["fixed acidity", "volatile acidity", "citric acid", "residual sugar",
           "chlorides", "free sulfur dioxide", "total sulfur dioxide", "density",
           "pH", "sulphates", "alcohol", "quality"]
'''

file = codecs.open(filePath, 'r', 'utf-8')
data = file.readlines()

for i in range(len(data)):
    if i == 0:
    	# strip 只能删除【首尾】的指定字符
        data[0] = [item.strip('"') for item in data[i].split(';')]
        # 注意到最后还有一个换行符,对最后一个串额外 strip
        data[0][len(data[0]) - 1] = data[0][len(data[0]) - 1].strip('"\n')
        continue
    data[i] = [float(item) for item in data[i].split(';')]

wine_df = pd.DataFrame(columns=data[0], data=data[1:])
wine_df.drop_duplicates(inplace=True)

print(wine_df.head())
print(wine_df.describe())
''' 统计各品质占比的代码可参考这个 '''
# 分离特征与标签
features = wine_df.drop('quality', 1)
labels = wine_df['quality']

l = len(labels)
print('Statistic info of wine quality is as follows:')
for i in range(7):
    print('Quality = %d: %.3f%%' % (i + 3, labels[labels==i+3].count() / l * 100))

print('Quality between 5~7: %.3f%%' % (labels[(labels<8) & (labels>4)].count() / l * 100))
''' 统计特征取值个数的可参考这个 '''
col = wine_df.columns

unique_value = [len(wine_df[col[i]].unique()) for i in range(len(col))]
print(pd.DataFrame(data=unique_value, index=col, columns=['unique value']))
数据集划分
你也许听说过【训练集 验证集 测试集】这三个概念,具体什么含义随便一搜就有大神的精彩回答了。这里只补充一点在实际操作时三者的生成方式:
- 如果只给定了一整个的数据集,通常是先将其按划分为【训练集 S1 和测试集 S2】,测试集的比例大概是10%~25%;而在使用训练模型时有个 cv 参数——这个参数就是用来指定在【训练集 S1】中进一步划分出【训练集 S3 + 验证集 S4】的方式;cv 可以使用默认参数(通常为 k-fold),也可以使用 shuffle_split 人为指定,更详细地建议参考不同模型的说明文档;
- 有些情况下已经给定了验证集,此时可以使用 PredefinedSplit 指定,参考 这篇文章 ;
本文为前一种情况,使用 train_test_split 进行划分。
from sklearn.model_selection import train_test_split
# 测试集大小占 20%;random_state 设置为 0 表示完全随机,默认参数下不管运行几次划分结果都是一样的(伪随机)
features_train, features_test, labels_train, labels_test = train_test_split(
    features, labels, test_size=0.2, random_state=0)

print(features_train.shape)
print(features_test.shape)
特征选择
- 特征选择一方面是为了降低问题的维度和模型的复杂度,另一方面是为了尽量剔除无关的变量,提高模型性能;
- 从选择的数量上看,可以是按【个数】选择,也可以是按【比例】选择;本文有 11 个属性,不算多,姑且保留 9 个特征吧;
- 从选择的度量方式上看,常用的指标有 卡方统计值(CHI2)和互信息(MI);本文使用了效率较高的卡方;
from sklearn.feature_selection import SelectKBest, chi2

sp = SelectKBest(chi2, k=9)
features_train_selected = sp.fit_transform(features_train, labels_train)
# 你会发现如果你在此之前还没有划分数据集,那么下面这一行可以省略,只是结果可能会稍微不同
features_test_selected = sp.transform(features_test)

print(features_train_selected.shape)
print(features_test_selected.shape)
# 下面这三行纯粹是为了看到底剔除了哪些变量,如这里是倒数第三和倒数第四个被剔除了
print(sp.scores_)
print(sp.get_params())
print(sp.get_support())
异常值检测
- 前面提过可以直接把白酒品质较高或较低的删除,本文使用的是基于 LOF 的方法,剔除掉 10% 的数据
# drop fliers via LOF
def dropFliers(features, labels, threshold):
    from sklearn.neighbors import LocalOutlierFactor as LOF

    lof = LOF(contamination=threshold).fit(features)
    r_features = features[lof.negative_outlier_factor_ > lof.threshold_]
    r_labels = labels[lof.negative_outlier_factor_ > lof.threshold_]
    return r_features, r_labels

r_features_train_selected, r_labels_train = dropFliers(features_train_selected, labels_train, 0.1)
r_features_test_selected, r_labels_test = dropFliers(features_test_selected, labels_test, 0.1)

print(r_features_train_selected.shape)
print(r_features_test_selected.shape)
离散化
- 本实验采用的是基于聚类分析的方法,对所有的特征都作离散化处理,聚类个数统一定为 20 ;
- 我当时做大作业时只选了其中四个取值最多的变量作离散化,聚类个数也只有 6 ,至于为何这么选……靠直觉吧。
''' 这里放的代码基本是上一篇文章的例子 '''
# K-Means based discretization
def cls_cut(features, k):
    from sklearn.cluster import KMeans as km
    import pandas as pd
    import pyprind

    pper = pyprind.ProgPercent(features.shape[1])
    for i in range(features.shape[1]):
        # n_josbs=-1 表示使用 CPU 所有的核
        model = km(n_clusters=k, n_jobs=-1, init='k-means++')
        model.fit(features[:, i].reshape(features.shape[0], 1))
        cls = pd.DataFrame(model.cluster_centers_).sort_values(0)
        border = cls.rolling(2).mean()[1:]
        # 千万记得在 min() 后面 -1(或者减去任意正数),因为经实验猜测 cut 的划分方式是左开右闭
        # 不这样做的话, features 中的最小值会由于没被分配到任一区间内而被置为 nan 值
        border = [features[:, i].min() - 1] + list(border[0]) + [features[:, i].max()]

        features[:, i] = pd.cut(features[:, i], border, labels=cls[0].tolist())
        pper.update()

    return True

k = 20
cls_cut(r_features_train_selected, k)
cls_cut(r_features_test_selected, k)
标准化
- 这里选用 Z-Score 方法
def normalize(normalizer, features_train, features_test):
    r_features_train = normalizer.fit_transform(features_train)
    r_features_test = normalizer.transform(features_test)
    return r_features_train, r_features_test

from sklearn.preprocessing import StandardScaler
standardScaler = StandardScaler()
features_train_norm, features_test_norm = normalize(standardScaler,
                                                    r_features_train_selected, r_features_test_selected)
print(features_train_norm)
模型训练
分类器选择
- RandomForest:Bagging 集成方法的典型模型
- Adaboost:Boosting 集成方法的典型模型
评估指标选择
- 考虑到白酒各品质分布很不均匀,不使用准确度作为唯一指标,而是综合看精度、召回率以及 F1 值;
- 在参数调整过程中,本文只用 F1 值作为评分指标;
训练过程
参考 这篇文章
默认参数训练结果
from sklearn.ensemble import RandomForestClassifier, AdaBoostClassifier
from sklearn import metrics
import matplotlib.pyplot as plt

def clf(estimator, features_train, features_test, labels_train, labels_test):
    estimator.fit(features_train, labels_train)
    # 准确率
    print('Accuracy: %.3f%%' % (estimator.score(features_test, labels_test) * 100))
	# 混淆矩阵
    cm = metrics.confusion_matrix(labels_test, estimator.predict(features_test))
    print(cm)
    # 输出完整的分类结果
    print(metrics.classification_report(labels_test, estimator.predict(features_test)))
    plt.figure()
    plt.xlabel('Predicted labels')
    plt.ylabel('True labels')
    plt.imshow(cm)

rf = RandomForestClassifier()
print('\nTraining result for RandomForest:')
clf(rf, features_train_norm, features_test_norm, r_labels_train, r_labels_test)
ada = AdaBoostClassifier()
print('\nTraining result for AdaBoost:')
clf(ada, features_train_norm, features_test_norm, r_labels_train, r_labels_test)
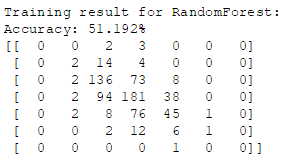
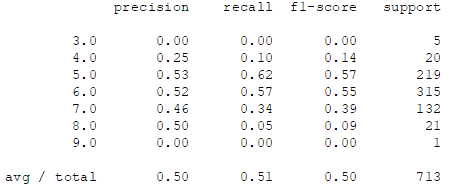
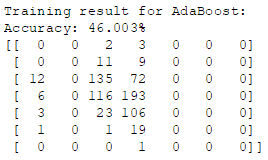
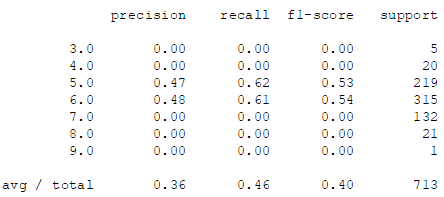
- 很明显可以看到,对于品质为 3,4,8 和 9 的样本,两个分类器分类效果非常差,说明这里选用 LOF 可能并不是个好的选择,你若是有兴趣的话建议在此基础上尝试其他的异常检测方案。
- 下面我们将以随机森林为例进行参数调整,更常见的说法是:参数遍历。
参数调整
def traversal(features, labels):
    from sklearn.model_selection import GridSearchCV as gs
    # 下面的参数全部是 RandomForestClassifier 中的参数
    # 简单起见,只选择其中 5 个参数作为示例,而且各参数的选值范围也较小
    params = {'n_estimators': range(10, 101, 10), 'criterion': ['gini', 'entropy'],
              'min_samples_split': range(2, 5, 1), 'min_samples_leaf': range(1, 3, 1),
              'max_features': ['auto', 'log2']}
    # scoring 选择 F1 值作为评估指标,由于这是多分类问题,所以需要用加权平均,cv=5 表示用 5-fold 交叉验证
    gridsearch = gs(estimator=RandomForestClassifier(), param_grid=params, scoring='f1_weighted', cv=5)
    gridsearch.fit(features, labels)
    print('\nBest parms:', gridsearch.best_params_)
    print('\nCorresponding best score:', gridsearch.best_score_)
    return True

traversal(features_train_norm, r_labels_train)
经过不算漫长的遍历过程后( 240 次),得到了如下的最优参数组合:![]()
最优训练结果
使用上面得到的最优参数组合重新训练,便是所谓的“最佳”训练结果(虽然在这里一点也不佳):
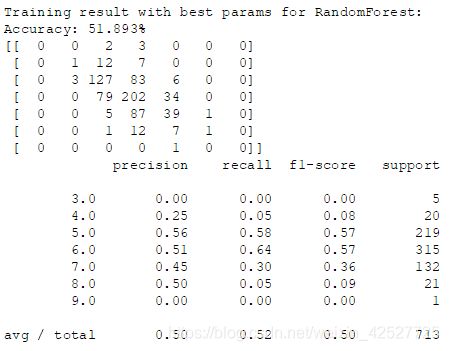
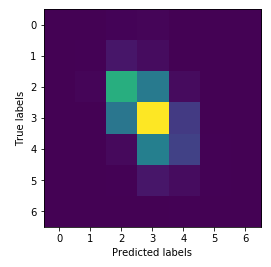
将训练模型的代码稍微改一下,把训练集上的数据也输出来,如下:
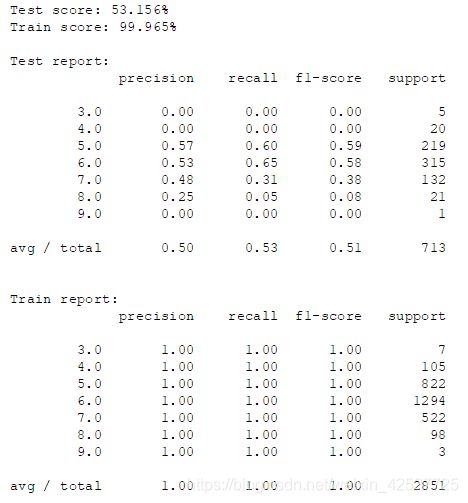
GG!在训练集上的结果非常好,四个指标几乎都是满分,怎么在测试集上就翻车了呢?这个例子很好地展示了啥叫【过拟合】。按理说随机森林的设计就是为了削弱过拟合的,但是为何还有这么严重的过拟合现象?推测最主要的原因在于噪音太大——也就是异常检测环节做得不够好;若是还要加一个原因的话就是数据量太小,然而作者提供的数据就这样了,知足吧。
结语
这篇文章,讲道理(按照传统的套路)应该是放在系列的末尾的。但是既然想到了就赶紧写了,希望能让初学者对【数据分析到底干了什么】这类问题有个技术性的认知(尽管本文的处理方式示例非常简单粗暴)。如果你有什么疑问,欢迎你给我留言,我会不时查看留言区,把好的问题放到后续的系列文章中(来自一只菜鸡的自捧)。
