glyph 24230 missing from current font.解决-matplotlib绘图踩坑
问题描述
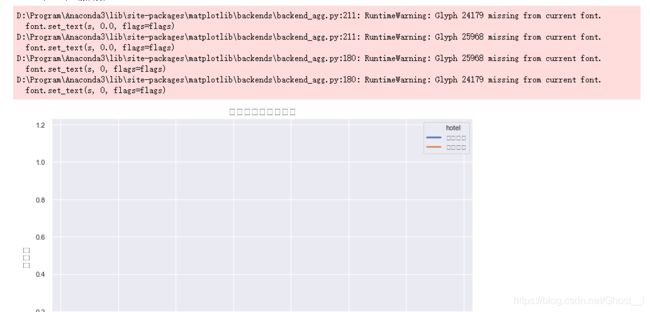
用matplotlib绘图的时候,title是中文 报错如下:
D:\Anaconda3\lib\site-packages\matplotlib\backends\backend_agg.py:100: RuntimeWarning: Glyph 24230 missing from current font.
  font.set_text(s, 0.0, flags=flags)
D:\Anaconda3\lib\site-packages\matplotlib\backends\backend_agg.py:120: RuntimeWarning: Glyph 38388 missing from current font.
  font.set_text(s, 0.0, flags=flags)
解决方案
在引入matplotlib库后作如下操作
import matplotlib.pyplot as plt
plt.rcParams[‘font.sans-serif’]=[‘SimHei’] #用来正常显示中文标签
plt.rcParams[‘axes.unicode_minus’]=False #用来正常显示负号
Example
## 没有写出导入数据部分
import numpy as np
import pandas as pd
import seaborn as sns
import matplotlib.pyplot as plt
from matplotlib.patches import  Rectangle,Circle
from matplotlib.collections import PatchCollection
%matplotlib inline

plt.rcParams['font.sans-serif']=["SimHei"] #用来正常显示中文标签
plt.rcParams['axes.unicode_minus']=False #用来正常显示负号
data = pd.read_csv('hotel_bookings.csv') ## https://www.kaggle.com/search?q=hotel+booking
data_new = data
data_new["adr_pp"] = data_new["adr"] / (data_new["adults"] + data_new["children"])
full_data_guests = data_new.loc[data_new["is_canceled"] == 0] # only actual gusts
room_prices = full_data_guests[["hotel", "reserved_room_type", "adr_pp"]].sort_values("reserved_room_type")
room_price_monthly = full_data_guests[["hotel", "arrival_date_month", "adr_pp"]].sort_values("arrival_date_month")

ordered_months = ["January", "February", "March", "April", "May", "June", "July", "August",
                 "September", "October", "November", "December"]
month_che = ["一月", "二月", "三月", "四月", "五月", "六月", "七月", "八月", "九月", "十月", "十一月", "十二月", ]

for en, che in zip(ordered_months, month_che):
    room_price_monthly["arrival_date_month"].replace(en, che, inplace=True)
room_price_monthly["arrival_date_month"] = pd.Categorical(room_price_monthly["arrival_date_month"],
                                                         categories=month_che, ordered=True)
room_price_monthly["hotel"].replace("City Hotel", "城市酒店", inplace=True)
room_price_monthly["hotel"].replace("Resort Hotel", "度假酒店", inplace=True)
room_price_monthly.head(15)

plt.figure(figsize=(12, 8))
sns.lineplot(x="arrival_date_month", y="adr_pp", hue="hotel", data=room_price_monthly,
            hue_order=["城市酒店", "度假酒店"], ci="sd", size="hotel", sizes=(2.5, 2.5))
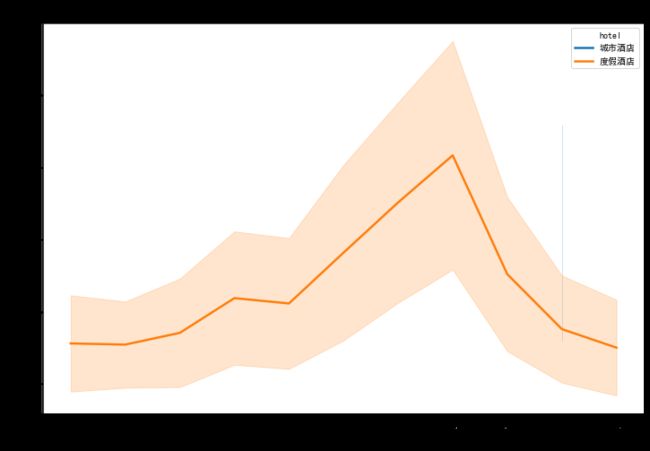
plt.title("不同月份人均居住价格/晚", fontsize=16)
plt.xlabel("月份", fontsize=16)
plt.ylabel("人均居住价格/晚", fontsize=16)
# plt.savefig("F:/文章/不同月份人均居住价格每晚")
参考:
解决Python使用matplotlib绘图时出现的中文乱码问题 (by 逝不等琴生)

