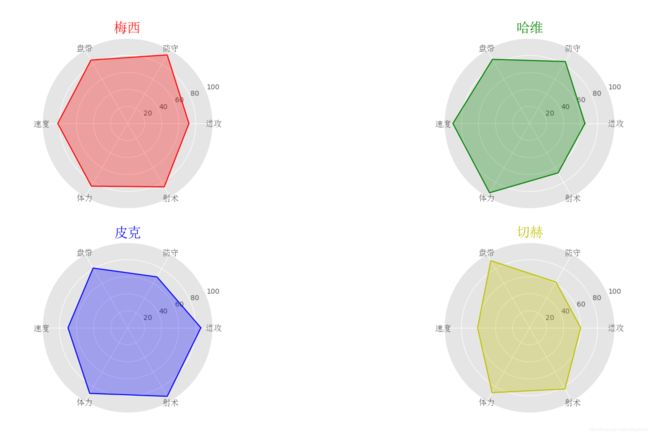
球员能力图
import matplotlib.pyplot as plt
import numpy as np
from matplotlib.font_manager import FontProperties
plt.style.use('ggplot')
font=FontProperties(fname=r'c:\windows\fonts\simsun.ttc',size=12)
ability_size=6
ability_lable=[u'进攻',u'防守',u'盘带',u'速度',u'体力',u'射术']
ax1=plt.subplot(221,projection='polar')
ax2=plt.subplot(222,projection='polar')
ax3=plt.subplot(223,projection='polar')
ax4=plt.subplot(224,projection='polar')
player={
'M':np.random.randint(size=ability_size,low=60,high=99),
'H':np.random.randint(size=ability_size,low=60,high=99),
'P':np.random.randint(size=ability_size,low=60,high=99),
'Q':np.random.randint(size=ability_size,low=60,high=99),
}
theta=np.linspace(0,2*np.pi,6,endpoint=False)
theta=np.append(theta,theta[0])
player['M']=np.append(player['M'],player['M'][0])
ax1.plot(theta,player['M'],'r')
ax1.fill(theta,player['M'],'r',alpha=0.3)
ax1.set_xticks(theta)
ax1.set_xticklabels(ability_lable,y=0.1,fontProperties=font)
ax1.set_title(u'梅西',position=(0.5,1.01),fontproperties=font,color='r',size=20)
ax1.set_yticks([20,40,60,80,100])
player['H']=np.append(player['H'],player['H'][0])
ax2.plot(theta,player['H'],'g')
ax2.fill(theta,player['H'],'g',alpha=0.3)
ax2.set_xticks(theta)
ax2.set_xticklabels(ability_lable,y=0.1,fontProperties=font)
ax2.set_title(u'哈维',position=(0.5,1.01),fontproperties=font,color='g',size=20)
ax2.set_yticks([20,40,60,80,100])
player['P']=np.append(player['P'],player['P'][0])
ax3.plot(theta,player['P'],'b')
ax3.fill(theta,player['P'],'b',alpha=0.3)
ax3.set_xticks(theta)
ax3.set_xticklabels(ability_lable,y=0.1,fontProperties=font)
ax3.set_title(u'皮克',position=(0.5,1.01),fontproperties=font,color='b',size=20)
ax3.set_yticks([20,40,60,80,100])
player['Q']=np.append(player['Q'],player['Q'][0])
ax4.plot(theta,player['Q'],'y')
ax4.fill(theta,player['Q'],'y',alpha=0.3)
ax4.set_xticks(theta)
ax4.set_xticklabels(ability_lable,y=0.1,fontProperties=font)
ax4.set_title(u'切赫',position=(0.5,1.01),fontproperties=font,color='y',size=20)
ax4.set_yticks([20,40,60,80,100])
plt.show()