预处理丨去趋势(Matlab和C++)
预处理丨去趋势(Matlab和C++)
- 预处理丨去趋势(Matlab和C++)
- 介绍
- 原理
- MATLAB 实现
- C++ 实现
本科没学过信号处理,对采集的数据需要做预处理,如去趋势,本文介绍一下去趋势的作用和方法!
介绍
1. 去趋势波动分析(detrended fluctuation analysis,DFA)算法是由 Peng 等提出的,适合分析信号的长程相关性的标度信号分析方法.
2. 去趋势波动分析能系统地去除序列中的各阶趋势,检测序列的长程幂律相关性,适用于各种非稳态时间序列研究。
3. 去趋势(detrend)处理可以消除传感器在获取数据时产生的偏移对后期计算产生的影响。从数据中删除趋势可以将分析集中在数据趋势本身的波动上。但是,去趋势的意义取决于自己的研究的目的。
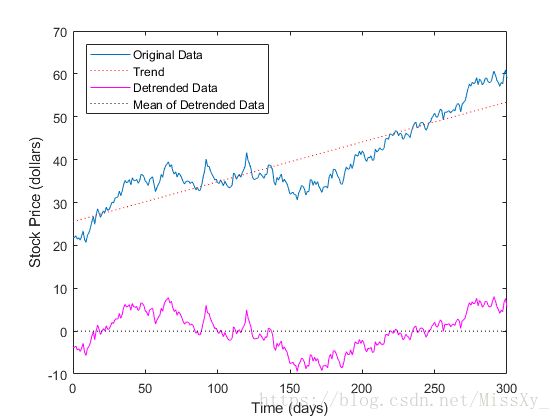
下图是去趋势前后对比:
原理
数据去趋势,就是对数据减去一条最优(最小二乘)的拟合直线、平面或曲面,使去趋势后的数据均值为零。
大致步骤:
1. 长度为 N N 的时间序列 x(t),t=1,2,⋯,N x ( t ) , t = 1 , 2 , ⋯ , N ,计算其累积离差值并转换为新序列:
其中, x¯ x ¯ 是时间序列的平均值: x¯=1N∑Nt=1x(t) x ¯ = 1 N ∑ t = 1 N x ( t )
2. 将 y(t) y ( t ) 以等长度 n n 划分为不重叠的 m m 个区间, n n 为区间长度,即时间尺度, m m 为区间(或窗口)
数量,为 Nn N n 的整数部分。
3. 对每一段序列采用最小二乘法线性拟合出局部趋势 yn(t) y n ( t ) ;
4. 对 y(t) y ( t ) 剔除每个区间的局部趋势,并计算新序列的均方根:
5. 改变窗口长度 n n 的大小,重复步骤(2)、(3)、(4);
MATLAB 实现
示例显示如何从每日收盘股价中消除线性趋势,以强调整体增长的价格波动。 如果数据确实有趋势,则将其趋势强制为零并减小总体变化。 该示例使用从库函数采用的分布模拟股票价格波动。
来源:官网手册
运行结果如上图!
clc
clear all
close all

%创建一个模拟数据集并计算其平均值。 sdata表示股票的每日价格变化。
t = 0:300;
dailyFluct = gallery('normaldata',size(t),2);
sdata = cumsum(dailyFluct) + 20 + t/100;
%计算均值
mean(sdata)

figure
plot(t,sdata);
legend('Original Data','Location','northwest');
xlabel('Time (days)');
ylabel('Stock Price (dollars)');

%计算去趋势数据,并且从原始数据中移除
detrend_sdata = detrend(sdata);
trend = sdata - detrend_sdata;
mean(detrend_sdata)

hold on
plot(t,trend,':r')
plot(t,detrend_sdata,'m')
plot(t,zeros(size(t)),':k')
legend('Original Data','Trend','Detrended Data',...
       'Mean of Detrended Data','Location','northwest')
xlabel('Time (days)');
ylabel('Stock Price (dollars)');
C++ 实现
代码核心来自:lppier
暂时只支持线型去趋势!
/************************************************************************************
    Function    : void detrend_IP(T *y, T *x, int m)
    Description : Remove the linear trend of the input floating point data. Note that this
                  will initialize a work buffer inside the function. So if you are calling
                  this many, many times, create your work buffer in the calling scope and call
                  detrend(T *y, T*x, int m) instead to avoid initializing memory over and over
                  again.
    Inputs      : y - Floating point input data
                 m - Input data length
    Outputs     : y - Data with linear trend removed
    Copyright   : DSO National Laboratories
    History     : 01/02/2008, TCK, Adapted from HYC code
                  01/12/2008, TCK, Added in return value
                  25/01/2016, Pier, Changed into template type, removed need for work buffer
    *************************************************************************************/
template
void Detrend::detrend_IP(T *y, int m)
{
    T xmean, ymean;
    int i;
    T temp;
    T Sxy;
    T Sxx;

    T grad;
    T yint;

    std::unique_ptr x(new T[m]);

    /********************************
    Set the X axis Liner Values
    *********************************/
    for (i = 0; i < m; i++)
        x[i] = i;

    /********************************
    Calculate the mean of x and y
    *********************************/
    xmean = 0;
    ymean = 0;
    for (i = 0; i < m; i++)
    {
        xmean += x[i];
        ymean += y[i];
    }
    xmean /= m;
    ymean /= m;

    /********************************
    Calculate Covariance
    *********************************/
    temp = 0;
    for (i = 0; i < m; i++)
        temp += x[i] * y[i];
    Sxy = temp / m - xmean * ymean;

    temp = 0;
    for (i = 0; i < m; i++)
        temp += x[i] * x[i];
    Sxx = temp / m - xmean * xmean;

    /********************************
    Calculate Gradient and Y intercept
    *********************************/
    grad = Sxy / Sxx;
    yint = -grad * xmean + ymean;

    /********************************
    Removing Linear Trend
    *********************************/
    for (i = 0; i < m; i++)
        y[i] = y[i] - (grad * i + yint);
}
主程序测试:
#include 